Hello im having trouble with proxmox on a dell r430

jackjackson

New Member
Mar 20, 2023
19
0
1
Hello thanks for reading this post
I have an issue where some times i get a lot of restarts-botloops with proxmox, the bios is up to date, checked bios settings ,and HW is alright everything green, proxmox it self is up to date as well
but i cant figure out why its doing it i would like to ask how can i collect the full log of proxmox from shell because syslog is not realy usefull.
also i noticed i get zfs service errors at boot could this cause those random restart errors? (i have auto start vm-s on as well)
1704162269918.png
 
I would have a look at journalctl -u pve*, for potential hardware related issues dmesg and to see more details regarding your suspected culprit journalctl -u zfs*.

As long as you are comfortable posting these (perhaps redacted), you can include the outputs as attachments or post anything you find obviously interesting into a [ SPOILER ] [ CODE ] [ /CODE ] [ /SPOILER ] block.
 
Do you use High Availability features? Is this a cluster? Tell us more about the setup if a cluster.
nope, i dont have zfs on my first node so i cant even use replication or HA even if i wanted to. i will either need a coplete overhaul or buy more disk to use zfs
 
I would have a look at journalctl -u pve*, for potential hardware related issues dmesg and to see more details regarding your suspected culprit journalctl -u zfs*.

As long as you are comfortable posting these (perhaps redacted), you can include the outputs as attachments or post anything you find obviously interesting into a [ SPOILER ] [ CODE ] [ /CODE ] [ /SPOILER ] block.
thank you for the commands will post later, this night the server restart loops again. and idrac is just post these 1704232522948.png
 
1. ZFS journal log
Jan 01 23:59:14 vmn2 zed[3401]: ZFS Event Daemon 2.2.2-pve1 (PID 3401)
Jan 01 23:59:14 vmn2 zed[3401]: Processing events since eid=0
Jan 01 23:59:14 vmn2 zed[3457]: eid=10 class=config_sync pool='storagepool'
Jan 02 00:00:22 vmn2 systemd[1]: Stopped target zfs.target - ZFS startup target.
Jan 02 00:00:22 vmn2 systemd[1]: Stopped target zfs-import.target - ZFS pool import target.
Jan 02 00:00:22 vmn2 systemd[1]: Stopped target zfs-volumes.target - ZFS volumes are ready.
Jan 02 00:00:22 vmn2 systemd[1]: zfs-share.service: Deactivated successfully.
Jan 02 00:00:22 vmn2 systemd[1]: Stopped zfs-share.service - ZFS file system shares.
Jan 02 00:00:22 vmn2 zed[3401]: Exiting
Jan 02 00:00:22 vmn2 systemd[1]: Stopping zfs-zed.service - ZFS Event Daemon (zed)...
Jan 02 00:00:22 vmn2 systemd[1]: zfs-zed.service: Deactivated successfully.
Jan 02 00:00:22 vmn2 systemd[1]: Stopped zfs-zed.service - ZFS Event Daemon (zed).
-- Boot 24ce560e0e0949e7b3b30fb97014e5a9 --
Jan 02 01:01:43 vmn2 systemd[1]: Starting zfs-import-cache.service - Import ZFS pools by cache file...
Jan 02 01:01:43 vmn2 systemd[1]: zfs-import-scan.service - Import ZFS pools by device scanning was skipped because of an unmet condition check (ConditionFile>
Jan 02 01:01:43 vmn2 systemd[1]: Starting zfs-import@storagepool.service - Import ZFS pool storagepool...
Jan 02 01:01:43 vmn2 zpool[2829]: cannot import 'storagepool': no such pool available
Jan 02 01:01:43 vmn2 systemd[1]: zfs-import@storagepool.service: Main process exited, code=exited, status=1/FAILURE
Jan 02 01:01:43 vmn2 systemd[1]: zfs-import@storagepool.service: Failed with result 'exit-code'.
Jan 02 01:01:43 vmn2 systemd[1]: Failed to start zfs-import@storagepool.service - Import ZFS pool storagepool.
Jan 02 01:01:49 vmn2 systemd[1]: Finished zfs-import-cache.service - Import ZFS pools by cache file.
Jan 02 01:01:49 vmn2 systemd[1]: Reached target zfs-import.target - ZFS pool import target.
Jan 02 01:01:49 vmn2 systemd[1]: Starting zfs-mount.service - Mount ZFS filesystems...
Jan 02 01:01:49 vmn2 systemd[1]: Starting zfs-volume-wait.service - Wait for ZFS Volume (zvol) links in /dev...
Jan 02 01:01:49 vmn2 zvol_wait[3297]: Testing 9 zvol links
Jan 02 01:01:49 vmn2 zvol_wait[3297]: All zvol links are now present.
Jan 02 01:01:49 vmn2 systemd[1]: Finished zfs-volume-wait.service - Wait for ZFS Volume (zvol) links in /dev.
Jan 02 01:01:49 vmn2 systemd[1]: Reached target zfs-volumes.target - ZFS volumes are ready.
Jan 02 01:01:50 vmn2 systemd[1]: Finished zfs-mount.service - Mount ZFS filesystems.
Jan 02 01:01:51 vmn2 systemd[1]: Starting zfs-share.service - ZFS file system shares...
Jan 02 01:01:51 vmn2 systemd[1]: Started zfs-zed.service - ZFS Event Daemon (zed).
Jan 02 01:01:51 vmn2 systemd[1]: Finished zfs-share.service - ZFS file system shares.
Jan 02 01:01:51 vmn2 systemd[1]: Reached target zfs.target - ZFS startup target.
Jan 02 01:01:51 vmn2 zed[3410]: ZFS Event Daemon 2.2.2-pve1 (PID 3410)
Jan 02 01:01:51 vmn2 zed[3410]: Processing events since eid=0
Jan 02 01:01:51 vmn2 zed[3476]: eid=8 class=pool_import pool='storagepool'
Jan 02 01:05:11 vmn2 systemd[1]: Stopped target zfs.target - ZFS startup target.

2. also some ipmi stuff but i looked it up and dell says just leave it alone
source: https://www.dell.com/support/manual...4e1233-a958-4a8d-b806-947ee600fd90&lang=en-us

another notable "error" is this maybe
1704235665067.png

1704235490357.png
 
Last edited:
1. ran dmesg with advanced commands maybe the warning can give us a clue

vmn2:~# dmesg --level=err,warn
[ 0.040171] #20 #21 #22 #23 #24 #25 #26 #27 #28 #29 #30 #31 #32 #33 #34 #35 #36 #37 #38 #39
[ 0.049904] MDS CPU bug present and SMT on, data leak possible. See https://www.kernel.org/doc/html/latest/admin-guide/hw-vuln/mds.html for more details.
[ 0.049904] MMIO Stale Data CPU bug present and SMT on, data leak possible. See https://www.kernel.org/doc/html/latest/admin-guide/hw-vuln/processor_mmio_stale_data.html for more details.
[ 0.069193] ENERGY_PERF_BIAS: Set to 'normal', was 'performance'
[ 0.069197] mtrr: your CPUs had inconsistent variable MTRR settings
[ 0.403411] pci 0000:01:00.0: [Firmware Bug]: disabling VPD access (can't determine size of non-standard VPD format)
[ 0.592942] device-mapper: core: CONFIG_IMA_DISABLE_HTABLE is disabled. Duplicate IMA measurements will not be recorded in the IMA log.
[ 0.593058] platform eisa.0: EISA: Cannot allocate resource for mainboard
[ 0.593060] platform eisa.0: Cannot allocate resource for EISA slot 1
[ 0.593061] platform eisa.0: Cannot allocate resource for EISA slot 2
[ 0.593063] platform eisa.0: Cannot allocate resource for EISA slot 3
[ 0.593065] platform eisa.0: Cannot allocate resource for EISA slot 4
[ 0.593066] platform eisa.0: Cannot allocate resource for EISA slot 5
[ 0.593067] platform eisa.0: Cannot allocate resource for EISA slot 6
[ 0.593069] platform eisa.0: Cannot allocate resource for EISA slot 7
[ 0.593070] platform eisa.0: Cannot allocate resource for EISA slot 8
[ 4.443487] scsi 0:0:32:0: Wrong diagnostic page; asked for 10 got 0
[ 5.571193] spl: loading out-of-tree module taints kernel.
[ 5.605442] zfs: module license 'CDDL' taints kernel.
[ 5.605446] Disabling lock debugging due to kernel taint
[ 5.605470] zfs: module license taints kernel.
[ 12.139721] systemd[1]: /lib/systemd/system/ceph-volume@.service:8: Unit uses KillMode=none. This is unsafe, as it disables systemd's process lifecycle management for the service. Please update the service to use a safer KillMode=, such as 'mixed' or 'control-group'. Support for KillMode=none is deprecated and will eventually be removed.
[ 13.750738] ACPI Error: No handler for Region [SYSI] (00000000c572f8ad) [IPMI] (20230331/evregion-130)
[ 13.750842] ACPI Error: Region IPMI (ID=7) has no handler (20230331/exfldio-261)

[ 13.750940] No Local Variables are initialized for Method [_GHL]

[ 13.750942] No Arguments are initialized for method [_GHL]

[ 13.750945] ACPI Error: Aborting method \_SB.PMI0._GHL due to previous error (AE_NOT_EXIST) (20230331/psparse-529)
[ 13.751053] ACPI Error: Aborting method \_SB.PMI0._PMC due to previous error (AE_NOT_EXIST) (20230331/psparse-529)
[ 13.751158] ACPI: \_SB_.PMI0: _PMC evaluation failed: AE_NOT_EXIST
[ 14.264042] ipmi_si dmi-ipmi-si.0: The BMC does not support setting the recv irq bit, compensating, but the BMC needs to be fixed.
[ 33.430863] kauditd_printk_skb: 8 callbacks suppressed
[ 33.743259] lxc-autostart[4042]: memfd_create() called without MFD_EXEC or MFD_NOEXEC_SEAL set
[ 51.746994] kvm_intel: L1TF CPU bug present and SMT on, data leak possible. See CVE-2018-3646 and https://www.kernel.org/doc/html/latest/admin-guide/hw-vuln/l1tf.html for details.
[ 116.509902] kauditd_printk_skb: 1 callbacks suppressed
[ 117.055369] overlayfs: fs on '/var/lib/docker/overlay2/check-overlayfs-support2022317137/lower2' does not support file handles, falling back to xino=off.
[ 126.928263] overlayfs: fs on '/var/lib/docker/overlay2/metacopy-check1130782682/l1' does not support file handles, falling back to xino=off.
[ 140.380110] overlayfs: fs on '/var/lib/docker/overlay2/l/ZB34EMC4IECCCKS3MLR63RJ3IF' does not support file handles, falling back to xino=off.
[ 140.496121] overlayfs: fs on '/var/lib/docker/overlay2/l/ZZNN2VPZJDPGGPFXRA3OS3HCRK' does not support file handles, falling back to xino=off.
[ 140.649685] overlayfs: fs on '/var/lib/docker/overlay2/l/REX7PBR4FZPTZTS3PA57OHULNT' does not support file handles, falling back to xino=off.
[ 140.782838] overlayfs: fs on '/var/lib/docker/overlay2/l/PP5QWNCYQRKP7NRFYLNDPOAL47' does not support file handles, falling back to xino=off.
[ 141.027550] overlayfs: fs on '/var/lib/docker/overlay2/l/BZTALGMCAP4KFGSPJETDUZBIVH' does not support file handles, falling back to xino=off.
[ 141.223381] overlayfs: fs on '/var/lib/docker/overlay2/l/MWMBY3DV57BZXUAFROU3I7RK2C' does not support file handles, falling back to xino=off.
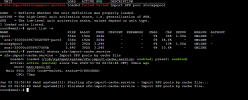
 
I would have a look at journalctl -u pve*, for potential hardware related issues dmesg and to see more details regarding your suspected culprit journalctl -u zfs*.

thank you for the commands will post later, this night the server restart loops again

What you can do with journalctl is use -b switch to show specific boot, for instance -b -1 is the the last boot, so if the current boot has started with a random reboot, it might be interesting to look at the end of the logs of the previous, whether it was e.g. shutting down or just "lost power", even show everything that preceeded the event, just journalctl -b -1 | tail -100 for example.

As long as you are comfortable posting these (perhaps redacted), you can include the outputs as attachments or post anything you find obviously interesting into a [ ICODE ][ SPOILER ] [ CODE ] [ /CODE ] [ /SPOILER ][ /ICODE ] block.

If you can enclose the output into the a block of tags, (no spaces inside the square brackets, I have to make them so that it shows it here) like [ CODE ] and [ /CODE ], it will be more readable, like so:

Code:
Jan 01 23:59:14 vmn2 zed[3401]: ZFS Event Daemon 2.2.2-pve1 (PID 3401)
Jan 01 23:59:14 vmn2 zed[3401]: Processing events since eid=0
Jan 01 23:59:14 vmn2 zed[3457]: eid=10 class=config_sync pool='storagepool'
Jan 02 00:00:22 vmn2 systemd[1]: Stopped target zfs.target - ZFS startup target.
Jan 02 00:00:22 vmn2 systemd[1]: Stopped target zfs-import.target - ZFS pool import target.
Jan 02 00:00:22 vmn2 systemd[1]: Stopped target zfs-volumes.target - ZFS volumes are ready.
Jan 02 00:00:22 vmn2 systemd[1]: zfs-share.service: Deactivated successfully.
Jan 02 00:00:22 vmn2 systemd[1]: Stopped zfs-share.service - ZFS file system shares.
Jan 02 00:00:22 vmn2 zed[3401]: Exiting
Jan 02 00:00:22 vmn2 systemd[1]: Stopping zfs-zed.service - ZFS Event Daemon (zed)...
Jan 02 00:00:22 vmn2 systemd[1]: zfs-zed.service: Deactivated successfully.
Jan 02 00:00:22 vmn2 systemd[1]: Stopped zfs-zed.service - ZFS Event Daemon (zed).
-- Boot 24ce560e0e0949e7b3b30fb97014e5a9 --
Jan 02 01:01:43 vmn2 systemd[1]: Starting zfs-import-cache.service - Import ZFS pools by cache file...
Jan 02 01:01:43 vmn2 systemd[1]: zfs-import-scan.service - Import ZFS pools by device scanning was skipped because of an unmet condition check (ConditionFile>
Jan 02 01:01:43 vmn2 systemd[1]: Starting zfs-import@storagepool.service - Import ZFS pool storagepool...
Jan 02 01:01:43 vmn2 zpool[2829]: cannot import 'storagepool': no such pool available
Jan 02 01:01:43 vmn2 systemd[1]: zfs-import@storagepool.service: Main process exited, code=exited, status=1/FAILURE
Jan 02 01:01:43 vmn2 systemd[1]: zfs-import@storagepool.service: Failed with result 'exit-code'.
Jan 02 01:01:43 vmn2 systemd[1]: Failed to start zfs-import@storagepool.service - Import ZFS pool storagepool.
Jan 02 01:01:49 vmn2 systemd[1]: Finished zfs-import-cache.service - Import ZFS pools by cache file.
Jan 02 01:01:49 vmn2 systemd[1]: Reached target zfs-import.target - ZFS pool import target.
Jan 02 01:01:49 vmn2 systemd[1]: Starting zfs-mount.service - Mount ZFS filesystems...
Jan 02 01:01:49 vmn2 systemd[1]: Starting zfs-volume-wait.service - Wait for ZFS Volume (zvol) links in /dev...
Jan 02 01:01:49 vmn2 zvol_wait[3297]: Testing 9 zvol links
Jan 02 01:01:49 vmn2 zvol_wait[3297]: All zvol links are now present.
Jan 02 01:01:49 vmn2 systemd[1]: Finished zfs-volume-wait.service - Wait for ZFS Volume (zvol) links in /dev.
Jan 02 01:01:49 vmn2 systemd[1]: Reached target zfs-volumes.target - ZFS volumes are ready.
Jan 02 01:01:50 vmn2 systemd[1]: Finished zfs-mount.service - Mount ZFS filesystems.
Jan 02 01:01:51 vmn2 systemd[1]: Starting zfs-share.service - ZFS file system shares...
Jan 02 01:01:51 vmn2 systemd[1]: Started zfs-zed.service - ZFS Event Daemon (zed).
Jan 02 01:01:51 vmn2 systemd[1]: Finished zfs-share.service - ZFS file system shares.
Jan 02 01:01:51 vmn2 systemd[1]: Reached target zfs.target - ZFS startup target.
Jan 02 01:01:51 vmn2 zed[3410]: ZFS Event Daemon 2.2.2-pve1 (PID 3410)
Jan 02 01:01:51 vmn2 zed[3410]: Processing events since eid=0
Jan 02 01:01:51 vmn2 zed[3476]: eid=8 class=pool_import pool='storagepool'
Jan 02 01:05:11 vmn2 systemd[1]: Stopped target zfs.target - ZFS startup target.

So, you are saying you never used any ZFS pool on that machine?
 
What you can do with journalctl is use -b switch to show specific boot, for instance -b -1 is the the last boot, so if the current boot has started with a random reboot, it might be interesting to look at the end of the logs of the previous, whether it was e.g. shutting down or just "lost power", even show everything that preceeded the event, just journalctl -b -1 | tail -100 for example.


If you can enclose the output into the a block of tags, (no spaces inside the square brackets, I have to make them so that it shows it here) like [ CODE ] and [ /CODE ], it will be more readable, like so:


So, you are saying you never used any ZFS pool on that machine?
for clarity i have 2 servers in node config vmn2 and vmn1/ vmn2 is the problematic one that has zfs vmn1 does not have it. it was my first machine ever and it has a perc h710 so its uses HW-raid. vmn2 has a shitty h330 with no cache and vmn2 has this random restart error or bug.
 
hi together,

i have more or less the same "behavior" since yesterday. I have random reboots of my proxmox installation without any hint in the logfiles.

I am running just one single server installation on a zotac z box.

Some generic information...

Code:
root@pve:~# pveversion
pve-manager/8.1.3/b46aac3b42da5d15 (running kernel: 6.5.11-7-pve)

Code:
root@pve:~# cat /etc/os-release
PRETTY_NAME="Debian GNU/Linux 12 (bookworm)"
NAME="Debian GNU/Linux"
VERSION_ID="12"
VERSION="12 (bookworm)"
VERSION_CODENAME=bookworm
ID=debian

Code:
root@pve:~# uname -a
Linux pve 6.5.11-7-pve #1 SMP PREEMPT_DYNAMIC PMX 6.5.11-7 (2023-12-05T09:44Z) x86_64 GNU/Linux

Code:
root@pve:~# df
Filesystem           1K-blocks     Used Available Use% Mounted on
udev                  16277332        0  16277332   0% /dev
tmpfs                  3262204     1240   3260964   1% /run
/dev/mapper/pve-root  98497780 12714692  80733540  14% /
tmpfs                 16311000    46800  16264200   1% /dev/shm
tmpfs                     5120        0      5120   0% /run/lock
efivarfs                   192       26       162  14% /sys/firmware/efi/efivars
/dev/sda2              1046508      344   1046164   1% /boot/efi
/dev/fuse               131072       32    131040   1% /etc/pve
tmpfs                  3262200        0   3262200   0% /run/user/0

Code:
root@pve:~# top
top - 14:06:22 up  3:59,  2 users,  load average: 0.10, 0.14, 0.16
Tasks: 235 total,   1 running, 234 sleeping,   0 stopped,   0 zombie
%Cpu(s):  0.8 us,  0.4 sy,  0.0 ni, 98.2 id,  0.3 wa,  0.0 hi,  0.0 si,  0.0 st
MiB Mem :  31857.4 total,  26272.0 free,   5088.2 used,    945.6 buff/cache
MiB Swap:   8192.0 total,   8192.0 free,      0.0 used.  26769.2 avail Mem

Code:
root@pve:~# vmstat
procs -----------memory---------- ---swap-- -----io---- -system-- ------cpu-----
 r  b   swpd   free   buff  cache   si   so    bi    bo   in   cs us sy id wa st
 2  0      0 26902252 344028 624056    0    0    22    32  252  426  0  0 99  0  0

Attaching journalctl logs as txt.

Finally I have no idea where to investigate further or what the reason is.

Thank you all for your help and @jackjackson I hope I can support also solving your and my :-) problem.
 

Attachments

Last edited:
hi together,

i have more or less the same "behavior" since yesterday. I have random reboots of my proxmox installation without any hint in the logfiles.

I am running just one single server installation on a zotac z box.

Some generic information...

Code:
root@pve:~# pveversion
pve-manager/8.1.3/b46aac3b42da5d15 (running kernel: 6.5.11-7-pve)

Code:
root@pve:~# cat /etc/os-release
PRETTY_NAME="Debian GNU/Linux 12 (bookworm)"
NAME="Debian GNU/Linux"
VERSION_ID="12"
VERSION="12 (bookworm)"
VERSION_CODENAME=bookworm
ID=debian

Code:
root@pve:~# uname -a
Linux pve 6.5.11-7-pve #1 SMP PREEMPT_DYNAMIC PMX 6.5.11-7 (2023-12-05T09:44Z) x86_64 GNU/Linux

Code:
root@pve:~# df
Filesystem           1K-blocks     Used Available Use% Mounted on
udev                  16277332        0  16277332   0% /dev
tmpfs                  3262204     1240   3260964   1% /run
/dev/mapper/pve-root  98497780 12714692  80733540  14% /
tmpfs                 16311000    46800  16264200   1% /dev/shm
tmpfs                     5120        0      5120   0% /run/lock
efivarfs                   192       26       162  14% /sys/firmware/efi/efivars
/dev/sda2              1046508      344   1046164   1% /boot/efi
/dev/fuse               131072       32    131040   1% /etc/pve
tmpfs                  3262200        0   3262200   0% /run/user/0

Code:
root@pve:~# top
top - 14:06:22 up  3:59,  2 users,  load average: 0.10, 0.14, 0.16
Tasks: 235 total,   1 running, 234 sleeping,   0 stopped,   0 zombie
%Cpu(s):  0.8 us,  0.4 sy,  0.0 ni, 98.2 id,  0.3 wa,  0.0 hi,  0.0 si,  0.0 st
MiB Mem :  31857.4 total,  26272.0 free,   5088.2 used,    945.6 buff/cache
MiB Swap:   8192.0 total,   8192.0 free,      0.0 used.  26769.2 avail Mem

Code:
root@pve:~# vmstat
procs -----------memory---------- ---swap-- -----io---- -system-- ------cpu-----
 r  b   swpd   free   buff  cache   si   so    bi    bo   in   cs us sy id wa st
 2  0      0 26902252 344028 624056    0    0    22    32  252  426  0  0 99  0  0

Attaching journalctl logs as txt.

Finally I have no idea where to investigate further or what the reason is.

Thank you all for your help and @jackjackson I hope I can support also solving your and my :) problem.
Sometimes it's a good idea to join in, I am afraid not in this case - as you mention nothing that could be suspected in the logs right away and completely different hardware. I think (but I do not moderate it:)) you would benefit from own thread, especially someone might know the zotacs better. The main info missing from you is - is this fresh install? Post upgrade? Did this run before on lower version without issues? How frequently does it reboot? SMART of the drive say what?
 
Trying to answer your questions...

Appearance:
I updated my 7.x release regulary. I cannot say if the problem occurs since a specific update. After the problem was there I updated from 7.x to 8.x hoping that would solve the problem. But... unfortunately not.

I am not able to reproduce the fault. Means... I cannot answer that question finally. But according to me "feeling" it wasn`t related to an update (otherwise I would have recognized it).

No fresh installation, running since months.

SMART results:
Code:
root@pve:~# smartctl -l selftest /dev/sda2
smartctl 7.3 2022-02-28 r5338 [x86_64-linux-6.5.11-7-pve] (local build)
Copyright (C) 2002-22, Bruce Allen, Christian Franke, www.smartmontools.org

=== START OF READ SMART DATA SECTION ===
SMART Self-test log structure revision number 1
Num  Test_Description    Status                  Remaining  LifeTime(hours)  LBA_of_first_error
# 1  Short offline       Completed without error       00%      1405         -

--> Without any errors.

Own thread:
Hmm.... don't think it's a hardware problem, as there are no signs of it on my end, nor, from my very superficial understanding, on Jack's end. Therefore I thought to join this conversation would be useful as the problem on high level appears to be the same. Occured yesterday, not able to reproduce or see any problems in the logs.

But get your point, will watch and maybe create an own thread.
 
Last edited:
well for me things are running fine again but this is just an anomaly at this point. and the idrac doesent help either it just shows cpu reseting which is bs. the only thing that temporarily solved the problem was unplugging it 10 sec wait then give it power again. i might have a clue if i have time ill maybe start running around the caps inside the server to get some voltage readings. but again idrac would raise alert if something is off the charts.
 
well for me things are running fine again but this is just an anomaly at this point. and the idrac doesent help either it just shows cpu reseting which is bs. the only thing that temporarily solved the problem was unplugging it 10 sec wait then give it power again. i might have a clue if i have time ill maybe start running around the caps inside the server to get some voltage readings. but again idrac would raise alert if something is off the charts.
Have you recently upgraded to 8.1? Is this a new problem? You sounded like it's been running on that setup for quite a while.
 
SMART results:
Code:
root@pve:~# smartctl -l selftest /dev/sda2
smartctl 7.3 2022-02-28 r5338 [x86_64-linux-6.5.11-7-pve] (local build)
Copyright (C) 2002-22, Bruce Allen, Christian Franke, www.smartmontools.org

=== START OF READ SMART DATA SECTION ===
SMART Self-test log structure revision number 1
Num  Test_Description    Status                  Remaining  LifeTime(hours)  LBA_of_first_error
# 1  Short offline       Completed without error       00%      1405         -

--> Without any errors.
I'd rather see the rest of the details too with smartctl -a /dev/...
 

About

The Proxmox community has been around for many years and offers help and support for Proxmox VE, Proxmox Backup Server, and Proxmox Mail Gateway.
We think our community is one of the best thanks to people like you!

Get your subscription!

The Proxmox team works very hard to make sure you are running the best software and getting stable updates and security enhancements, as well as quick enterprise support. Tens of thousands of happy customers have a Proxmox subscription. Get yours easily in our online shop.

Buy now!