Having weird data loss issues with ZFS

Taudris

New Member
Jul 10, 2023
7
0
1
Alright, weird log messages from Proxmox 7.3 first in case it's an immediate indication of a problem, then lots of detail about my setup after. This is a hand-picked selection of events, not contiguous. One of the offsets appears numerous times. The 'storage' pool has 3 WD140EDGZ drives; all 3 have messages about extremely long deadman delays. (The longest are over 114 days! The rest are around 5-10 minutes.)

Code:
Jul 09 07:17:03 pve zed[374088]: eid=100 class=deadman pool='storage' vdev=ata-WDC_WD140EDGZ-11B1PA0_9MGWXR5J-part1 size=323584 offset=2499019612160 priority=0 err=0 flags=0x40080c80 delay=9861900884ms
Jul 09 07:17:03 pve zed[374092]: eid=102 class=deadman pool='storage' vdev=ata-WDC_WD140EDGZ-11B1PA0_Y5KUYX8D-part2 size=270336 offset=2499019608064 priority=0 err=0 flags=0x40080c80 delay=9861900884ms
Jul 09 07:17:03 pve zed[374211]: eid=141 class=deadman pool='storage' vdev=ata-WDC_WD140EDGZ-11B1PA0_Y5KTNW2C-part2 size=4096 offset=2499019603968 priority=0 err=0 flags=0x180880 delay=9861900883ms bookmark=2879:1:0:380361960
Jul 09 07:18:05 pve zed[2663]: Missed 18 events
Jul 09 07:18:05 pve zed[2663]: Bumping queue length to 2048
Jul 09 07:18:09 pve zed[2663]: Missed 59 events
Jul 09 07:18:09 pve zed[2663]: Bumping queue length to 16384
Jul 09 07:18:58 pve zed[374890]: eid=266 class=delay pool='storage' vdev=ata-WDC_WD140EDGZ-11B1PA0_Y5KTNW2C-part2 size=4096 offset=2499019550720 priority=0 err=0 flags=0x180880 delay=427946ms bookmark=2879:1:0:380361950
Jul 09 07:18:58 pve zed[374848]: eid=252 class=delay pool='storage' vdev=ata-WDC_WD140EDGZ-11B1PA0_Y5KUYX8D-part2 size=4096 offset=2499019526144 priority=0 err=0 flags=0x180880 delay=427910ms bookmark=2879:1:0:380361946
Jul 09 07:18:58 pve zed[374869]: eid=259 class=delay pool='storage' vdev=ata-WDC_WD140EDGZ-11B1PA0_9MGWXR5J-part1 size=4096 offset=2499019534336 priority=0 err=0 flags=0x180880 delay=427927ms bookmark=2879:1:0:380361947
Jul 09 07:18:58 pve zed[374845]: eid=251 class=delay pool='storage' vdev=ata-WDC_WD140EDGZ-11B1PA0_Y5KTNW2C-part2 size=1048576 offset=2514958422016 priority=2 err=0 flags=0x40080c80 delay=427938ms
Jul 09 07:18:58 pve zed[374903]: eid=270 class=delay pool='storage' vdev=ata-WDC_WD140EDGZ-11B1PA0_Y5KUYX8D-part2 size=1044480 offset=12997430239232 priority=2 err=0 flags=0x40080c80 delay=427988ms
Jul 09 07:18:58 pve zed[374899]: eid=269 class=delay pool='storage' vdev=ata-WDC_WD140EDGZ-11B1PA0_9MGWXR5J-part1 size=323584 offset=2499019612160 priority=0 err=0 flags=0x40080c80 delay=427956ms

I have a very small homelab setup with a single server running Proxmox 7.3 with 3 VMs. (I can't get more specific than that because I upgraded to 7.4 today...)

One of the VMs is a file server running Windows Server 2022 and the RedHat VirtIO guest driver package v0.1.229. For storage, I have two VM disks, both on the same ZFS RAIDZ1 pool of 3x WD140EDGZ drives. (One of the disks is backed up to the cloud.) The disks are formatted with NTFS.

Both VM disks are using VirtIO SCSI with the settings as follows: Cache=Default (No cache), Discard=checked, IO thread=checked, SSD emulation=checked, Read-only=unchecked, Backup=unchecked, Skip replication=checked, Async IO=Default (io_uring).
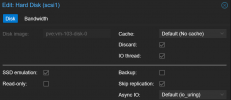
1688956160600.png

Performance of this setup is both bad and inconsistent. While transferring a single big file, it fluctuates between around 50-100MB/sec over gigabit ethernet. These drives are fast enough that I originally expected it to saturate the link (112MB/sec or so). I've tried troubleshooting it before and failed. (I don't have enough storage to change the design without losing data or paying to restore from my cloud backup.) Regardless, it's still fast enough for my use case of basic photo/video/document storage, so I decided to just live with it.

Originally, I was using the onboard SATA ports for the storage. In January, I got an LSI 9201-8i pre-flashed in IT mode (courtesy theartofserver) so that I could isolate the H97 chipset as a potential source of speed problems. Speed didn't improve, but seemingly nothing got worse, and I got more ports out of it, so I moved on.

Since then, some files have seemingly-randomly gone missing. I found a hidden and nearly-inaccessible folder called "found.001" with most of the missing files inside (though probably in varying states of completeness). This clearly suggests that the NTFS file table is getting corrupted somehow. Presumably, the writes that take nearly 4 months to complete are related...

My only idea at the moment is maybe I should put a fan on the LSI card, or try different SAS->SATA cables. The Windows file server crashed in the kernel with 0x0000007e several hours after I started a backup while a zfs scrub was running in the background, so I guess I have a way to confirm whether the problem has been fixed, lol.
 
Have you checked the physical health of the harddrive with smartctl ? Also a memtest for your ram could be a good idea

Can I have the output of journalctl -b ?
 
These old HBAs might also not be that reliable anymore. Got three IT-mode SAS2008s and one of them started to fail. I/O errors of all disks attached to it and sometimes after a couple of hours all the disks were missing. Replaced that HBA with another one and everything fine since then.

So if you didn't had any problems with the onboard disk controller, I would try to use it to rule out a bad HBA.

And yes, those HBAs aren't meant for use in a tower case. The datasheet gives exact numbers of airflow that is needed to cool the hba and these can't be reached without a lot of screeming server fans or screwing a 40mm fan directly on the cards heatsink (turning that card into dual/tripple slot).
 
Last edited:
I looked at /var/log/messages and /var/log/syslog per theartofserver's troubleshooting video and didn't find any errors related to the controller. I only find messages from zed.

I've attached the requested logs. The filtering I did for journalctl.filtered.log was just to remove a bunch of sssd-related spam. (Went from 20MB to <1MB.)

Note that while I included the smartctl output for all of the drives, I'm only really using the 14TB drives and the M500 SSD. The others are just sitting there idle (and for all I know, potentially causing problems).

I've found that trying to run a local-to-cloud backup using restic is enough to kill the server. The problem seems to be triggered by sustained I/O.

I somehow got myself under the impression that using hard drives on the HBA (as opposed to SSDs) would not cause it to heat up enough to be a concern. It's possible that that information was about older hard drives, while these can push upwards of 200MB/sec each. I'll go ahead and put a fan on the HBA just in case that could be the cause and try another backup. It still strikes me as weird that there's no errors outside of zed, though.

If it still fails to do a backup, I'll switch back to the onboard SATA ports and see how that goes.
 

Attachments

Last edited:
Installed the fan, started a new backup, and troubles started within a minute or so:
  • The VM GUI was responsive and I could interact with the C drive, but any actions even slightly dependent on the D/E drives (backed by the two zvols on the 14TB hard drives) became unresponsive. (I think I've noticed this symptom in the past, possibly even before getting the HBA..?)
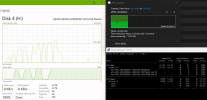
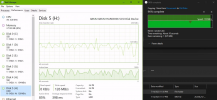
  • In Windows Task Manager for the disks backed by the zvol, the active time went to 100%.
  • When I cancelled the backup, significant I/O continued for a long time (10+ minutes) according to this command: zpool iostat -v -y 10 1
  • Windows logged more "Reset to device, \Device\RaidPort2, was issued." (also RaidPort3) and NTFS corruption. (Windows might have been attempting some file system repair, which could be the cause of the significant ongoing I/O.)
  • journalctl -x shows the same kinds of problems. zed only logs delays, no errors about corruption.
 

Attachments

You can try zpool status zfs list or a
smartctl -t <device> but I think you disk is just very slow in general. Have you considered replacing it?
 
I don't think speed is the issue. When I use fio on the host to do a sequential write test to the ZFS pool that contains the VM zvols, I get 239MiB/sec.

Code:
root@pve:/storage/pve# fio --rw=write --bs=1m --direct=1 --ioengine=libaio --size=20G --filename /storage/pve/fiotest.0.0 --name=job
job: (g=0): rw=write, bs=(R) 1024KiB-1024KiB, (W) 1024KiB-1024KiB, (T) 1024KiB-1024KiB, ioengine=libaio, iodepth=1
fio-3.25
Starting 1 process
job: Laying out IO file (1 file / 20480MiB)
Jobs: 1 (f=1): [W(1)][97.7%][eta 00m:02s]
job: (groupid=0, jobs=1): err= 0: pid=3134410: Sat Jul 15 00:46:03 2023
  write: IOPS=238, BW=239MiB/s (250MB/s)(20.0GiB/85736msec); 0 zone resets
    slat (usec): min=87, max=8631.8k, avg=4183.13, stdev=154044.58
    clat (nsec): min=616, max=240803, avg=1389.30, stdev=2855.36
     lat (usec): min=88, max=8631.8k, avg=4184.93, stdev=154044.69
    clat percentiles (nsec):
     |  1.00th=[   660],  5.00th=[   732], 10.00th=[   788], 20.00th=[   852],
     | 30.00th=[   916], 40.00th=[   972], 50.00th=[  1032], 60.00th=[  1096],
     | 70.00th=[  1208], 80.00th=[  1416], 90.00th=[  2320], 95.00th=[  3216],
     | 99.00th=[  5344], 99.50th=[  8896], 99.90th=[ 14912], 99.95th=[ 17792],
     | 99.99th=[162816]
   bw (  MiB/s): min=  144, max= 4095, per=100.00%, avg=1321.38, stdev=1236.82, samples=30
   iops        : min=  144, max= 4095, avg=1321.30, stdev=1236.79, samples=30
  lat (nsec)   : 750=5.99%, 1000=39.09%
  lat (usec)   : 2=42.88%, 4=9.31%, 10=2.32%, 20=0.37%, 50=0.02%
  lat (usec)   : 100=0.01%, 250=0.02%
  cpu          : usr=0.32%, sys=3.11%, ctx=43427, majf=0, minf=12
  IO depths    : 1=100.0%, 2=0.0%, 4=0.0%, 8=0.0%, 16=0.0%, 32=0.0%, >=64=0.0%
     submit    : 0=0.0%, 4=100.0%, 8=0.0%, 16=0.0%, 32=0.0%, 64=0.0%, >=64=0.0%
     complete  : 0=0.0%, 4=100.0%, 8=0.0%, 16=0.0%, 32=0.0%, 64=0.0%, >=64=0.0%
     issued rwts: total=0,20480,0,0 short=0,0,0,0 dropped=0,0,0,0
     latency   : target=0, window=0, percentile=100.00%, depth=1

Run status group 0 (all jobs):
  WRITE: bw=239MiB/s (250MB/s), 239MiB/s-239MiB/s (250MB/s-250MB/s), io=20.0GiB (21.5GB), run=85736-85736msec

I decided to try using my two ancient 4 TB drives as a test. They should manage comfortably over 150MB/sec on the fast part of the platters.

I created a ZFS mirror called storage2 with volblocksize=4KiB, compression off, and did a file transfer over the network. The transfer speed kept dropping to zero for long periods of time (tens of seconds). zpool iostat showed continued write activity during these periods.

This is all sequential I/O on empty drives. I expect it to saturate the gigabit link, keep up with the writes with speed to spare, and drop to zero disk activity immediately when the transfer completes. So why is it behaving like this?

1689406513232.png

fio test on storage2 achieved 111MiB/sec, so right on the edge of what a gigabit network can muster.

Code:
root@pve:/storage/pve# fio --rw=write --bs=1m --direct=1 --ioengine=libaio --size=20G --filename /storage2/fiotest --name=job
job: (g=0): rw=write, bs=(R) 1024KiB-1024KiB, (W) 1024KiB-1024KiB, (T) 1024KiB-1024KiB, ioengine=libaio, iodepth=1
fio-3.25
Starting 1 process
job: Laying out IO file (1 file / 20480MiB)
Jobs: 1 (f=1): [W(1)][94.4%][eta 00m:11s]
job: (groupid=0, jobs=1): err= 0: pid=3201895: Sat Jul 15 00:52:45 2023
  write: IOPS=111, BW=111MiB/s (116MB/s)(20.0GiB/184336msec); 0 zone resets
    slat (usec): min=80, max=12790k, avg=8998.07, stdev=304181.27
    clat (nsec): min=618, max=276965, avg=1267.98, stdev=2769.28
     lat (usec): min=81, max=12790k, avg=8999.71, stdev=304181.44
    clat percentiles (nsec):
     |  1.00th=[  676],  5.00th=[  716], 10.00th=[  748], 20.00th=[  796],
     | 30.00th=[  828], 40.00th=[  868], 50.00th=[  924], 60.00th=[ 1020],
     | 70.00th=[ 1192], 80.00th=[ 1432], 90.00th=[ 1848], 95.00th=[ 2448],
     | 99.00th=[ 6432], 99.50th=[ 8896], 99.90th=[11712], 99.95th=[13888],
     | 99.99th=[48896]
   bw (  MiB/s): min=   24, max= 4118, per=100.00%, avg=1379.43, stdev=1175.72, samples=28
   iops        : min=   24, max= 4118, avg=1379.43, stdev=1175.72, samples=28
  lat (nsec)   : 750=9.84%, 1000=48.65%
  lat (usec)   : 2=33.47%, 4=5.89%, 10=1.77%, 20=0.34%, 50=0.02%
  lat (usec)   : 250=0.01%, 500=0.01%
  cpu          : usr=0.16%, sys=1.43%, ctx=32279, majf=0, minf=13
  IO depths    : 1=100.0%, 2=0.0%, 4=0.0%, 8=0.0%, 16=0.0%, 32=0.0%, >=64=0.0%
     submit    : 0=0.0%, 4=100.0%, 8=0.0%, 16=0.0%, 32=0.0%, 64=0.0%, >=64=0.0%
     complete  : 0=0.0%, 4=100.0%, 8=0.0%, 16=0.0%, 32=0.0%, 64=0.0%, >=64=0.0%
     issued rwts: total=0,20480,0,0 short=0,0,0,0 dropped=0,0,0,0
     latency   : target=0, window=0, percentile=100.00%, depth=1

Run status group 0 (all jobs):
  WRITE: bw=111MiB/s (116MB/s), 111MiB/s-111MiB/s (116MB/s-116MB/s), io=20.0GiB (21.5GB), run=184336-184336msec

I also did a test where I passed through the individual disks to the VM, set them up as a mirror in Windows, and did the same file transfer. I got exactly the behavior I expected. (The big dip in speed was from me copying a different smaller file at the same time to see how it would handle the extra load. It split the network speed between the two transfers perfectly.)

1689406494342.png

Why can't I get this behavior out of ZFS?I don't know what I'm doing wrong. :(

The reason I'm not using NTFS directly on disk as in this test is that I want ZFS's checksumming and self-healing capabilities. Before switching to Proxmox+ZFS, I was using Hyper-V and Storage Spaces with some flavor of parity, but it always gave me really bad disk performance. (I probably set it up wrong somehow, but didn't have a backup at the time to help get me out of that hole.)
 
Last edited:
I don't think the ZFS layout matters for the tests I've done. The fact remains that a sequential fio test on the host performs well while a sequential copy in the VM does not. This suggests that the problem is elsewhere. (I actually also got fio running in the VM, but the behavior is essentially the same as the sequential file copy in terms of performance and stalling, so I didn't write about it.)
Running fio on the OS disk which is managed by LVM and backed by a cheap SSD shows decent performance. There is some performance loss in the VM vs on the host, but it's not enough to be bothersome, and certainly doesn't stall.

I noticed msinfo32 reports the disk sector size in the guest VM as 512. I was able to get Windows to report a sector size of 4096 for the test partition by adding this line to the vm config file:

Code:
args: -set device.scsi4.logical_block_size=4096 -set device.scsi4.physical_block_size=4096

While interesting, it didn't help with the bad performance and stalling.

When I use VirtIO Block, I see the active time for the disk in Task Manager go to 100% much sooner, but it otherwise behaves the same.
 

About

The Proxmox community has been around for many years and offers help and support for Proxmox VE, Proxmox Backup Server, and Proxmox Mail Gateway.
We think our community is one of the best thanks to people like you!

Get your subscription!

The Proxmox team works very hard to make sure you are running the best software and getting stable updates and security enhancements, as well as quick enterprise support. Tens of thousands of happy customers have a Proxmox subscription. Get yours easily in our online shop.

Buy now!