General Protection Fault Crash That I Can't Seem to Solve!

KingDigweed

Member
Nov 19, 2021
28
1
8
Hello Proxmox folks, I hope you are well.

I am once again asking kindly for your assistance with a very frustrating stability issue on my Proxmox VE server. Attached is the error in question from the syslog, though I'll happily provide any other information required.

Now, I would normally state here what I suspect to be causing the problem, and the reason(s) for my suspicons, but this time I really feel at a complete loss. I can't even say something as primitive as "when the system is under load", as it really does appear to be random. If someone could help me find what part of the system these crashes are tied to, I could certainly have a think about how my use of the server could tie in, and drill down from there.

Here is the list of things I've tried or checked so far:
  • Return of the host machine and exchange for replacement. It is a refurbished unit so different CPU, motherboard, power supply - I provide my own RAM & storage.
  • Installed brand new 2x16GB RAM kit which is compatibility certified for my machine
  • BIOS updated to latest version
  • Lastest Intel Microcode installed
  • Lastest firmware installed for boot SSD
  • Opted-in to the Linux 6.2 kernel (a good idea? CPU is Intel 7700)
  • Latest PVE updates installed
  • fsck of host and all CTs & VMs come back clean
  • Temperatures remain reasonable at all times & loads
  • No VMs or CTs are near to running out of disk space or memory
  • Host is also nowhere near exhausting CPU, RAM, storage capacity etc.

Here is a quick list of things which I believe may be worth noting which are specific to my setup. I will gladly elaborate further, but am listing in brief here in case anything sets of alarm bells!
  • I have a script which runs at 5AM each day to fstrim -av the PVE host and then pct fstrim all running CTs. I do this as I wasn't confident that this was happening (or at least regularly enough) but am certain a crash has never happened along side this script running. I would very much welcome any advice around this topic by the way!
  • I have an OPNsense VM running on the machine which is the router for the LAN. I pass through the two ports of an Intel I350-T2 NIC to this VM to act as the LAN and WAN links. This VM has exclusive access to these ports. All other VMs/CTs use a bridge of the motherboard's ethernet ports. Occassionally I see the lines such as these in the syslog. I'm not sure if this is a problem but it seems odd to me:
    May 05 03:18:43 OptiPlex7050 kernel: vmbr1: port 2(tap501i0) entered disabled state
    May 05 03:18:43 OptiPlex7050 kernel: vmbr1: port 2(tap501i0) entered blocking state
    May 05 03:18:43 OptiPlex7050 kernel: vmbr1: port 2(tap501i0) entered forwarding state
  • I have an 18TB SATA HDD in the system which acts as mass storage for my media centre. This is passed through directly to the media centre CT (and an SMB CT) as a mount point. (All VMs/CTs run on the M.2 SSD)
  • I have had similar issues with general protection fault crashes on this machine before (another Proxmox Forum post), but am quite confident that these were in fact due to a mixed kit of RAM, half of which were not truly compatible. As above, I am now solely running a new, 2x16GB kit.
  • Generally, I feel as though the system is more susceptible to crashing whilst under some amount of load, perhaps IO - however, it has crashed whilst seemingly at idle also. The system has crashed before whilst completing a backup job, and also whilst a CT running qBittorrent was doing some heavy lifting, for instance.
  • Sometimes when doing large, high-speed downloads to the hard drive for my media centre, I see the IO delay statistic jump to 33%. I am assuming this represents the hard drive reaching 100% utilisation, which shows as 33% in the dashboard as I have two other drives making up the remaining 67% - the SSD which runs the host and all CTs/VMs and a 2TB HDD which is only for backups to reside on.

If anyone can lend any assistance, I would be hugely grateful as I'm really quite frustrated with this now. I'm just at a bit of a loose end now and feeling a tad hopeless.

That said, I'm highly motivated to find and resolve the issue so anything at all will be welcome to hear and try out. If there are any logs to check, tests to run or questions to answer, please do let me know. I've already spent numerous late nights and tens of hours on this, so what's a few more? o_O

Thank you,

Chris
 

Attachments

Last edited:
Just happened again. I tried to attach the syslog but the file is too large! (This crash generated a lot of spam). Uploaded to Google Drive here.

Only load on the system was a single qBittorrent download operating at about 75 megabytes/sec download. CPU usage about 15-20% at the time.

Also, when getting back online, I pct fsck all of the running CTs, only to have to wait for most of them due to the following message. Any advice on how come? Nothing else is running at the time so Idon't know why I'd have to wait...
MMP interval is 10 seconds and total wait time is 42 seconds. Please wait...
 
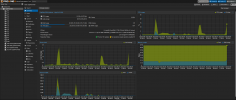
Issues again. This time not a total crash and lockup of the system - it would appear that my VMs and CTs are still running. But the Proxmox GUI is kinda broken... right before the crash you can see a spike in RAM and CPU and I can't think what would have caused this...
GUI.png

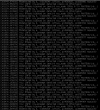
I managed to remote on using the on-board Intel vPro system and could see this from the remote desktop. No ability to interact however.
Output.png

I did manage to log in via SSH, though between entering my password and being presented with a shell was far longer than usual - a number of minutes before getting through. I tried to shutdown gracefully but this failed too:

Code:
root@OptiPlex7050:~# shutdown
Failed to set wall message, ignoring: Connection timed out
Failed to call ScheduleShutdown in logind, no action will be taken: Connection timed out

I also tried reboot now but this just produced nothing and returned me to the shell. Had to do my usual power cycle.

Again, I've had to upload the syslog to Google Drive due to it's size, though I gather it is mostly just repeated crash information.
 
Ok so digging deeper on this latest, slightly different crash - it appears to correlate with a transcode within my Plex container. The RAM and CPU spike occurred specifically on my Plex CT and the logs show a transcode job occurring at the time, so at least somewhat of a load being placed on the system. For now, I've disabled transcoding in case this helps stability, but this is not great for the long term and can't surely be the root cause which I wish to identify and resolve permanently.
 
Just had another crash. This time no logs at all seem to have been produced! Even a remote view of the virtual display of the host just showed a frozen system login screen. Quite odd, not had that in particular happen before. Again, no notable load or operations going on (at least to my mind of course!).
 
A little bump - anyone able to lend their thoughts?

It seems like additional load & IO can increase the chances of a crash, but I feel like suggesting anything more is just speculation. My real problem at the minute is just knowing where to start... I'd love to answer all sorts of questions about my set up as I wonder if even that information could help point towards a solution.
 
Thanks for the reply Gabriel - It is definitely CMR as this was something I was cautious of whilst making the purchase. Does this sound like it could be related to the hard drive and it's throughput / utilisation like I mentioned before. If you told me it was I could easily believe you. If so, any thoughts on a solution. Currently my CTs using it have it mounted directly as a mount point...

EDIT: HDD model is ST18000NM000J for info
 
Ok so immediately after doing some further digging, I found this post which could relate:
https://www.reddit.com/r/truenas/comments/p1ebnf/seagate_exos_load_cyclingidling_info_solution/

Perhaps the drive's power saving features, such as being spun down after a while, could be the issue?

Surely others in the community would have run into similar at some point - can anyone lend advice on this? Thank you!
I've now applied the latest firmware for the drive and used the SeaChest tools described in the Reddit post above to disable the various power saving features. Have confirmed all applied OK. SMART data shows that after about 7 months of use, the load cycle count is over 8600. Let's see what happens.

If anyone else still has any input I'm all ears!
 
Hi everyone, really hoping for some more assistance here, this is driving me crazy now...

Today it happened again, couldn't particularly suggest why. Here is the trace from the syslog:
Code:
May 25 10:56:47 OptiPlex7050 kernel: BUG: unable to handle page fault for address: ffffffff9ec55500
May 25 10:56:47 OptiPlex7050 kernel: #PF: supervisor write access in kernel mode
May 25 10:56:47 OptiPlex7050 kernel: #PF: error_code(0x0002) - not-present page
May 25 10:56:47 OptiPlex7050 kernel: PGD 22b815067 P4D 22b815067 PUD 22b816063 PMD 1110c4063 PTE 800ffffdd43aa062
May 25 10:56:47 OptiPlex7050 kernel: Oops: 0002 [#1] PREEMPT SMP PTI
May 25 10:56:47 OptiPlex7050 kernel: CPU: 3 PID: 2249863 Comm: kworker/u16:4 Tainted: P           O       6.2.11-2-pve #1
May 25 10:56:47 OptiPlex7050 kernel: Hardware name: Dell Inc. OptiPlex 7050/0NW6H5, BIOS 1.24.0 12/22/2022
May 25 10:56:47 OptiPlex7050 kernel: Workqueue: ext4-rsv-conversion ext4_end_io_rsv_work
May 25 10:56:47 OptiPlex7050 kernel: RIP: 0010:native_queued_spin_lock_slowpath+0x2ad/0x300
May 25 10:56:47 OptiPlex7050 kernel: Code: 41 89 d7 44 0f b7 f0 41 83 ef 01 49 c1 e6 05 4d 63 ff 49 81 c6 00 25 03 00 49 81 ff ff 1f 00 00 77 45 4e 03 34 fd c0 9a 61 9e <49> 89 1e 8b 43 08 85 c0 75 09 f3 90 8b 43 08 85 c0 74 f7 48 8b 13
May 25 10:56:47 OptiPlex7050 kernel: RSP: 0018:ffffb0d1c7d77d38 EFLAGS: 00010086
May 25 10:56:47 OptiPlex7050 kernel: RAX: 0000000000000000 RBX: ffff89c10dcf2500 RCX: 00000000000000a2
May 25 10:56:47 OptiPlex7050 kernel: RDX: 0000000000000bc0 RSI: 000000002f000000 RDI: ffff89ba54db39bc
May 25 10:56:47 OptiPlex7050 kernel: RBP: ffffb0d1c7d77d60 R08: 0000000000000001 R09: 0000000000037c80
May 25 10:56:47 OptiPlex7050 kernel: R10: 0000000040000000 R11: 0000000000000800 R12: ffff89ba54db39bc
May 25 10:56:47 OptiPlex7050 kernel: R13: 0000000000100000 R14: ffffffff9ec55500 R15: 0000000000000bbf
May 25 10:56:47 OptiPlex7050 kernel: FS:  0000000000000000(0000) GS:ffff89c10dcc0000(0000) knlGS:0000000000000000
May 25 10:56:47 OptiPlex7050 kernel: CS:  0010 DS: 0000 ES: 0000 CR0: 0000000080050033
May 25 10:56:47 OptiPlex7050 kernel: CR2: ffffffff9ec55500 CR3: 000000022b810002 CR4: 00000000003726e0
May 25 10:56:47 OptiPlex7050 kernel: Call Trace:
May 25 10:56:47 OptiPlex7050 kernel:  <TASK>
May 25 10:56:47 OptiPlex7050 kernel:  _raw_spin_lock_irqsave+0x42/0x50
May 25 10:56:47 OptiPlex7050 kernel:  ext4_finish_bio+0xe4/0x290
May 25 10:56:47 OptiPlex7050 kernel:  ext4_release_io_end+0x4f/0xe0
May 25 10:56:47 OptiPlex7050 kernel:  ext4_end_io_rsv_work+0xac/0x1c0
May 25 10:56:47 OptiPlex7050 kernel:  process_one_work+0x21c/0x430
May 25 10:56:47 OptiPlex7050 kernel:  worker_thread+0x50/0x3e0
May 25 10:56:47 OptiPlex7050 kernel:  ? __pfx_worker_thread+0x10/0x10
May 25 10:56:47 OptiPlex7050 kernel:  kthread+0xee/0x120
May 25 10:56:47 OptiPlex7050 kernel:  ? __pfx_kthread+0x10/0x10
May 25 10:56:47 OptiPlex7050 kernel:  ret_from_fork+0x29/0x50
May 25 10:56:47 OptiPlex7050 kernel:  </TASK>
May 25 10:56:47 OptiPlex7050 kernel: Modules linked in: xt_recent joydev input_leds hid_generic usbkbd usbmouse usbhid hid tcp_diag inet_diag binfmt_misc ip6t_REJECT nf_reject_ipv6 xt_hl ip6t_rt nft_limit ipt_REJECT nf_reject_ipv4 xt_LOG nf_log_syslog xt_comment xt_multiport xt_limit xt_addrtype xt_tcpudp xt_conntrack nf_conntrack nf_defrag_ipv6 nf_defrag_ipv4 nft_compat nfsd auth_rpcgss nfs_acl lockd grace veth ebtable_filter ebtables ip_set ip6table_raw iptable_raw ip6table_filter ip6_tables iptable_filter bpfilter nf_tables bonding tls softdog nfnetlink_log nfnetlink snd_hda_codec_hdmi snd_ctl_led snd_hda_codec_realtek snd_hda_codec_generic intel_rapl_msr intel_rapl_common intel_tcc_cooling snd_soc_avs x86_pkg_temp_thermal intel_powerclamp snd_soc_hda_codec snd_hda_ext_core coretemp kvm_intel snd_soc_core i915 snd_compress ac97_bus snd_pcm_dmaengine kvm snd_hda_intel snd_intel_dspcfg snd_intel_sdw_acpi drm_buddy irqbypass crct10dif_pclmul snd_hda_codec ttm polyval_clmulni polyval_generic drm_display_helper
May 25 10:56:47 OptiPlex7050 kernel:  ghash_clmulni_intel snd_hda_core sha512_ssse3 cec aesni_intel snd_hwdep rc_core dell_wmi crypto_simd snd_pcm mei_hdcp ledtrig_audio mei_pxp cryptd snd_timer drm_kms_helper dell_smbios rapl syscopyarea snd sysfillrect mei_me dell_wmi_aio dcdbas intel_cstate pcspkr dell_wmi_descriptor sparse_keymap intel_wmi_thunderbolt wmi_bmof serio_raw sysimgblt soundcore ee1004 mei zfs(PO) mac_hid acpi_pad zunicode(PO) zzstd(O) zlua(O) zavl(PO) icp(PO) zcommon(PO) znvpair(PO) spl(O) vhost_net vhost vhost_iotlb tap ib_iser rdma_cm iw_cm ib_cm ib_core iscsi_tcp libiscsi_tcp libiscsi scsi_transport_iscsi drm sunrpc ip_tables x_tables autofs4 btrfs blake2b_generic xor raid6_pq simplefb dm_thin_pool dm_persistent_data dm_bio_prison dm_bufio libcrc32c crc32_pclmul nvme xhci_pci psmouse igb i2c_i801 xhci_pci_renesas i2c_smbus e1000e i2c_algo_bit ahci intel_lpss_pci nvme_core dca intel_lpss nvme_common libahci xhci_hcd idma64 video wmi pinctrl_sunrisepoint
May 25 10:56:47 OptiPlex7050 kernel: CR2: ffffffff9ec55500
May 25 10:56:47 OptiPlex7050 kernel: ---[ end trace 0000000000000000 ]---
May 25 10:56:47 OptiPlex7050 kernel: RIP: 0010:native_queued_spin_lock_slowpath+0x2ad/0x300
May 25 10:56:47 OptiPlex7050 kernel: Code: 41 89 d7 44 0f b7 f0 41 83 ef 01 49 c1 e6 05 4d 63 ff 49 81 c6 00 25 03 00 49 81 ff ff 1f 00 00 77 45 4e 03 34 fd c0 9a 61 9e <49> 89 1e 8b 43 08 85 c0 75 09 f3 90 8b 43 08 85 c0 74 f7 48 8b 13
May 25 10:56:47 OptiPlex7050 kernel: RSP: 0018:ffffb0d1c7d77d38 EFLAGS: 00010086
May 25 10:56:47 OptiPlex7050 kernel: RAX: 0000000000000000 RBX: ffff89c10dcf2500 RCX: 00000000000000a2
May 25 10:56:47 OptiPlex7050 kernel: RDX: 0000000000000bc0 RSI: 000000002f000000 RDI: ffff89ba54db39bc
May 25 10:56:47 OptiPlex7050 kernel: RBP: ffffb0d1c7d77d60 R08: 0000000000000001 R09: 0000000000037c80
May 25 10:56:47 OptiPlex7050 kernel: R10: 0000000040000000 R11: 0000000000000800 R12: ffff89ba54db39bc
May 25 10:56:47 OptiPlex7050 kernel: R13: 0000000000100000 R14: ffffffff9ec55500 R15: 0000000000000bbf
May 25 10:56:47 OptiPlex7050 kernel: FS:  0000000000000000(0000) GS:ffff89c10dcc0000(0000) knlGS:0000000000000000
May 25 10:56:47 OptiPlex7050 kernel: CS:  0010 DS: 0000 ES: 0000 CR0: 0000000080050033
May 25 10:56:47 OptiPlex7050 kernel: CR2: ffffffff9ec55500 CR3: 000000022b810002 CR4: 00000000003726e0
May 25 10:56:47 OptiPlex7050 kernel: note: kworker/u16:4[2249863] exited with irqs disabled
May 25 10:56:47 OptiPlex7050 kernel: note: kworker/u16:4[2249863] exited with preempt_count 1
May 25 10:56:52 OptiPlex7050 kernel: general protection fault, probably for non-canonical address 0x1ff89ba11db7e48: 0000 [#2] PREEMPT SMP PTI
May 25 10:56:52 OptiPlex7050 kernel: CPU: 0 PID: 2252515 Comm: vgs Tainted: P      D    O       6.2.11-2-pve #1
May 25 10:56:52 OptiPlex7050 kernel: Hardware name: Dell Inc. OptiPlex 7050/0NW6H5, BIOS 1.24.0 12/22/2022
May 25 10:56:52 OptiPlex7050 kernel: RIP: 0010:__relink_lru+0x32/0x120 [dm_bufio]
May 25 10:56:52 OptiPlex7050 kernel: Code: e5 41 57 41 56 41 55 41 54 41 89 f4 53 44 0f b6 6f 49 48 89 fb c7 47 4c 01 00 00 00 4c 8b 77 78 49 83 fd 01 0f 87 95 00 00 00 <4f> 8b 7c ee 48 4d 85 ff 0f 84 85 00 00 00 49 83 fd 01 0f 87 a5 00
May 25 10:56:52 OptiPlex7050 kernel: RSP: 0018:ffffb0d1d44bf990 EFLAGS: 00010297
May 25 10:56:52 OptiPlex7050 kernel: RAX: 0000000000000000 RBX: ffff89ba527d3000 RCX: ffffb0d1d44bfa14
May 25 10:56:52 OptiPlex7050 kernel: RDX: 0000000000000001 RSI: 0000000000000000 RDI: ffff89ba527d3000
May 25 10:56:52 OptiPlex7050 kernel: RBP: ffffb0d1d44bf9b8 R08: ffffb0d1d44bfa18 R09: ffffb0d1d44bfa30
May 25 10:56:52 OptiPlex7050 kernel: R10: 0000000000003ecf R11: 0000000000000000 R12: 0000000000000000
May 25 10:56:52 OptiPlex7050 kernel: R13: 0000000000000000 R14: 01ff89ba11db7e00 R15: ffff89ba11db7e00
May 25 10:56:52 OptiPlex7050 kernel: FS:  00007fcd5a0a1180(0000) GS:ffff89c10dc00000(0000) knlGS:0000000000000000
May 25 10:56:52 OptiPlex7050 kernel: CS:  0010 DS: 0000 ES: 0000 CR0: 0000000080050033
May 25 10:56:52 OptiPlex7050 kernel: CR2: 00007ffed2561e38 CR3: 0000000227332002 CR4: 00000000003726f0
May 25 10:56:52 OptiPlex7050 kernel: Call Trace:
May 25 10:56:52 OptiPlex7050 kernel:  <TASK>
May 25 10:56:52 OptiPlex7050 kernel:  __bufio_new+0x8c/0x270 [dm_bufio]
May 25 10:56:52 OptiPlex7050 kernel:  ? mutex_lock+0x13/0x50
May 25 10:56:52 OptiPlex7050 kernel:  new_read+0x57/0x110 [dm_bufio]
May 25 10:56:52 OptiPlex7050 kernel:  dm_bufio_read+0x29/0x40 [dm_bufio]
May 25 10:56:52 OptiPlex7050 kernel:  dm_bm_read_lock+0x26/0x80 [dm_persistent_data]
May 25 10:56:52 OptiPlex7050 kernel:  dm_tm_read_lock+0x29/0xa0 [dm_persistent_data]
May 25 10:56:52 OptiPlex7050 kernel:  ro_step+0x36/0x70 [dm_persistent_data]
May 25 10:56:52 OptiPlex7050 kernel:  dm_btree_find_key+0xbd/0x190 [dm_persistent_data]
May 25 10:56:52 OptiPlex7050 kernel:  dm_btree_find_highest_key+0x16/0x20 [dm_persistent_data]
May 25 10:56:52 OptiPlex7050 kernel:  dm_thin_get_highest_mapped_block+0xb0/0xd0 [dm_thin_pool]
May 25 10:56:52 OptiPlex7050 kernel:  thin_status+0xca/0x260 [dm_thin_pool]
May 25 10:56:52 OptiPlex7050 kernel:  ? __mod_lruvec_page_state+0x123/0x150
May 25 10:56:52 OptiPlex7050 kernel:  retrieve_status+0xc7/0x210
May 25 10:56:52 OptiPlex7050 kernel:  table_status+0x94/0x150
May 25 10:56:52 OptiPlex7050 kernel:  ? __pfx_table_status+0x10/0x10
May 25 10:56:52 OptiPlex7050 kernel:  ctl_ioctl+0x216/0x650
May 25 10:56:52 OptiPlex7050 kernel:  dm_ctl_ioctl+0xe/0x20
May 25 10:56:52 OptiPlex7050 kernel:  __x64_sys_ioctl+0x92/0xd0
May 25 10:56:52 OptiPlex7050 kernel:  do_syscall_64+0x59/0x90
May 25 10:56:52 OptiPlex7050 kernel:  ? syscall_exit_to_user_mode+0x26/0x50
May 25 10:56:52 OptiPlex7050 kernel:  ? do_syscall_64+0x69/0x90
May 25 10:56:52 OptiPlex7050 kernel:  entry_SYSCALL_64_after_hwframe+0x72/0xdc
May 25 10:56:52 OptiPlex7050 kernel: RIP: 0033:0x7fcd5a58f237
May 25 10:56:52 OptiPlex7050 kernel: Code: 00 00 00 48 8b 05 59 cc 0d 00 64 c7 00 26 00 00 00 48 c7 c0 ff ff ff ff c3 66 2e 0f 1f 84 00 00 00 00 00 b8 10 00 00 00 0f 05 <48> 3d 01 f0 ff ff 73 01 c3 48 8b 0d 29 cc 0d 00 f7 d8 64 89 01 48
May 25 10:56:52 OptiPlex7050 kernel: RSP: 002b:00007ffed2565cf8 EFLAGS: 00000206 ORIG_RAX: 0000000000000010
May 25 10:56:52 OptiPlex7050 kernel: RAX: ffffffffffffffda RBX: 00005630624c792a RCX: 00007fcd5a58f237
May 25 10:56:52 OptiPlex7050 kernel: RDX: 0000563063334a90 RSI: 00000000c138fd0c RDI: 0000000000000004
May 25 10:56:52 OptiPlex7050 kernel: RBP: 00007ffed2565db0 R08: 000056306262d690 R09: 00007ffed2565b60
May 25 10:56:52 OptiPlex7050 kernel: R10: 000056306262d3b8 R11: 0000000000000206 R12: 000056306262c94a
May 25 10:56:52 OptiPlex7050 kernel: R13: 000056306262c94a R14: 000056306262c94a R15: 000056306262c94a
May 25 10:56:52 OptiPlex7050 kernel:  </TASK>
May 25 10:56:52 OptiPlex7050 kernel: Modules linked in: xt_recent joydev input_leds hid_generic usbkbd usbmouse usbhid hid tcp_diag inet_diag binfmt_misc ip6t_REJECT nf_reject_ipv6 xt_hl ip6t_rt nft_limit ipt_REJECT nf_reject_ipv4 xt_LOG nf_log_syslog xt_comment xt_multiport xt_limit xt_addrtype xt_tcpudp xt_conntrack nf_conntrack nf_defrag_ipv6 nf_defrag_ipv4 nft_compat nfsd auth_rpcgss nfs_acl lockd grace veth ebtable_filter ebtables ip_set ip6table_raw iptable_raw ip6table_filter ip6_tables iptable_filter bpfilter nf_tables bonding tls softdog nfnetlink_log nfnetlink snd_hda_codec_hdmi snd_ctl_led snd_hda_codec_realtek snd_hda_codec_generic intel_rapl_msr intel_rapl_common intel_tcc_cooling snd_soc_avs x86_pkg_temp_thermal intel_powerclamp snd_soc_hda_codec snd_hda_ext_core coretemp kvm_intel snd_soc_core i915 snd_compress ac97_bus snd_pcm_dmaengine kvm snd_hda_intel snd_intel_dspcfg snd_intel_sdw_acpi drm_buddy irqbypass crct10dif_pclmul snd_hda_codec ttm polyval_clmulni polyval_generic drm_display_helper
May 25 10:56:52 OptiPlex7050 kernel:  ghash_clmulni_intel snd_hda_core sha512_ssse3 cec aesni_intel snd_hwdep rc_core dell_wmi crypto_simd snd_pcm mei_hdcp ledtrig_audio mei_pxp cryptd snd_timer drm_kms_helper dell_smbios rapl syscopyarea snd sysfillrect mei_me dell_wmi_aio dcdbas intel_cstate pcspkr dell_wmi_descriptor sparse_keymap intel_wmi_thunderbolt wmi_bmof serio_raw sysimgblt soundcore ee1004 mei zfs(PO) mac_hid acpi_pad zunicode(PO) zzstd(O) zlua(O) zavl(PO) icp(PO) zcommon(PO) znvpair(PO) spl(O) vhost_net vhost vhost_iotlb tap ib_iser rdma_cm iw_cm ib_cm ib_core iscsi_tcp libiscsi_tcp libiscsi scsi_transport_iscsi drm sunrpc ip_tables x_tables autofs4 btrfs blake2b_generic xor raid6_pq simplefb dm_thin_pool dm_persistent_data dm_bio_prison dm_bufio libcrc32c crc32_pclmul nvme xhci_pci psmouse igb i2c_i801 xhci_pci_renesas i2c_smbus e1000e i2c_algo_bit ahci intel_lpss_pci nvme_core dca intel_lpss nvme_common libahci xhci_hcd idma64 video wmi pinctrl_sunrisepoint
May 25 10:56:52 OptiPlex7050 kernel: ---[ end trace 0000000000000000 ]---
May 25 10:56:52 OptiPlex7050 kernel: RIP: 0010:native_queued_spin_lock_slowpath+0x2ad/0x300
May 25 10:56:52 OptiPlex7050 kernel: Code: 41 89 d7 44 0f b7 f0 41 83 ef 01 49 c1 e6 05 4d 63 ff 49 81 c6 00 25 03 00 49 81 ff ff 1f 00 00 77 45 4e 03 34 fd c0 9a 61 9e <49> 89 1e 8b 43 08 85 c0 75 09 f3 90 8b 43 08 85 c0 74 f7 48 8b 13
May 25 10:56:52 OptiPlex7050 kernel: RSP: 0018:ffffb0d1c7d77d38 EFLAGS: 00010086
May 25 10:56:52 OptiPlex7050 kernel: RAX: 0000000000000000 RBX: ffff89c10dcf2500 RCX: 00000000000000a2
May 25 10:56:52 OptiPlex7050 kernel: RDX: 0000000000000bc0 RSI: 000000002f000000 RDI: ffff89ba54db39bc
May 25 10:56:52 OptiPlex7050 kernel: RBP: ffffb0d1c7d77d60 R08: 0000000000000001 R09: 0000000000037c80
May 25 10:56:52 OptiPlex7050 kernel: R10: 0000000040000000 R11: 0000000000000800 R12: ffff89ba54db39bc
May 25 10:56:52 OptiPlex7050 kernel: R13: 0000000000100000 R14: ffffffff9ec55500 R15: 0000000000000bbf
May 25 10:56:52 OptiPlex7050 kernel: FS:  00007fcd5a0a1180(0000) GS:ffff89c10dc00000(0000) knlGS:0000000000000000
May 25 10:56:52 OptiPlex7050 kernel: CS:  0010 DS: 0000 ES: 0000 CR0: 0000000080050033
May 25 10:56:52 OptiPlex7050 kernel: CR2: 00007ffed2561e38 CR3: 0000000227332002 CR4: 00000000003726f0
May 25 10:56:52 OptiPlex7050 pvestatd[1116]: command '/sbin/vgs --separator : --noheadings --units b --unbuffered --nosuffix --options vg_name,vg_size,vg_free,lv_count' failed: got signal 11

It would be hugely appreciated if anyone could suggest where to investigate next. Thank you.

Chris
 
Hello again,

Just had another crash, nothing seems to be different. :(

Please can anyone lend a hand? Any advice on the MMP interval message when running a pct fsck would be nice too as it would make recovery a lot faster if it didn't do that!

Thank you,

Chris
 
And another crash just occurred... Nothing in particular that jumps out at me.

Please, can anyone share their thoughts? I'd appreciate it more than you could know!

Chris
 
I've been trying to stick with it and find out what is most likely to be causing the sporadic crashes but am still not confident.

At the moment, my greatest suspicion is that perhaps giving privileged CTs direct access to the 18TB hard drive as a mount point doesn't play nicely, perhaps moreso when under load. Does anyone else have a similar setup or experience with this? Perhaps the Proxmox team could share their thoughts?

Alternatively, other ideas I've shortlisted are reverting the kernel version to 5.19 and/or disabling C-states. Input on these two would be awesome.

I'm not at all expecting the next reply to be a solution, but even a suggestion of which area I should concentrate on first would be brilliant.

Cheers,

Chris
 
Last edited:
Another crash, but this time it seems a bit more specific info on the problem - qBittorrent-nox (which is specific to one of my CTs) is listed in logs... Can someone help suggest what this might mean?

Again, had to upload this snippet to Google Drive as it tipped this comment over the character limit. It's not that long though!

Thank you,

Chris
 
swap temporary 18TB hdd by another more regular 4TB/8TB ...
Thanks for the reply Gabriel. I'd be a bit reluctant to try that at the moment as I have a lot of data stored on there and it is frequently in use. I also don't possess any other hard drives of a sufficient size to be able to hold the data temporarily... I might add that I'm confident in the drive in that it was bought new, has only been in use for a few months, is connected properly and hasn't been damaged etc.

Just wondering what your thought process is behind that suggestion? If you could elaborate perhaps I could find another way of testing whatever it is you're trying to get at :)

Cheers,

Chris
 
Last edited:
I've also come across a thread where someone suspected a particular VM to be causing similar crashes whilst under heavy IO load. They said that they resolved the crashing issue by "turning on write back cache".

Where I have passed my 18TB HDD through to CTs as a mount point, is there any way to enable write back cache for those? I know how to do it if it were for a full VM, but these are just containers...

Just a thought, if this even sounds like a sensible idea!
 
a shot in the dark ... you need to try something as the error doesn't help.
consumer motherboard keep disk write cache on the host.
but HP on their ProLiant Servers, disable disk write cache by default on their hw controller AND on the embedded sata.
you can check with hdparm -W /dev/sdX
 

About

The Proxmox community has been around for many years and offers help and support for Proxmox VE, Proxmox Backup Server, and Proxmox Mail Gateway.
We think our community is one of the best thanks to people like you!

Get your subscription!

The Proxmox team works very hard to make sure you are running the best software and getting stable updates and security enhancements, as well as quick enterprise support. Tens of thousands of happy customers have a Proxmox subscription. Get yours easily in our online shop.

Buy now!