Garbage collect takes longer day by day

imrelaszlo84

New Member
Oct 25, 2023
6
0
1
Hello!

Please help me, I can not find where is the problem. Software: Backup Server 3.0-3

There are two, identical datastores. Let's say: DATASTORE-OKAY; DATASTORE-SLOW.
They are mounted from a QNAP NAS with NFS. The NAS has an NVMe SSD cache on a top of ZFS.

DATASTORE-OKAY:

Index file count: 60
Original Data usage: 722.906 GiB
On-Disk usage: 20.307 GiB (2.81%)
On-Disk chunks: 31985
Deduplication Factor: 35.60

The garbage collect starts at 0:00; finishes at 0:09. This is okay, I think.

DATASTORE-SLOW:

Index file count: 31
Original Data usage: 30.289 TiB
On-Disk usage: 11.008 GiB (0.04%)
On-Disk chunks: 14075
Deduplication Factor: 2817.61

The garbage collection starts at 0:30, and today finished at 7:15 (!!!), takes 6 hours and 45 minutes (!!!)...

The interesting thing is that the amount of data does not increase, but the process takes 20 minutes longer every day.
This is how the garbage collection running time looks like for the past few days, copied from "Longest tasks (30 days)":

2023.10.26.: garbage collection takes 6:45:21
2023.10.25.: garbage collection takes 6:18:18
2023.10.24.: garbage collection takes 5:56:36
2023.10.23.: garbage collection takes 5:36:10
2023.10.22.: garbage collection takes 5:16:28
2023.10.21.: garbage collection takes 4:56:58
2023.10.20.: garbage collection takes 4:37:17
2023.10.19.: garbage collection takes 4:17:37
2023.10.18.: garbage collection takes 3:57:54

From day to day, is slower with ~20 minutes. In practice, it is exactly 20 minutes longer, every day.
There are no parallel tasks running, neither saving nor checking.

/etc/fstab:

[NAS-IP-ADDRESS]:/DATASTORE-OKAY /mnt/NAS/DATASTORE-OKAY nfs defaults 0 0
[NAS-IP-ADDRESS]:/DATASTORE-SLOW /mnt/NAS/DATASTORE-SLOW nfs defaults 0 0

mount:

[NAS-IP-ADDRESS]:/DATASTORE-SLOW on /mnt/NAS/DATASTORE-SLOW type nfs4 (rw,relatime,vers=4.2,rsize=1048576,wsize=1048576,namlen=255,hard,proto=tcp,timeo=600,retrans=2,sec=sys,clientaddr=172.21.111.220,local_lock=none,addr=[NAS-IP-ADDRESS])
[NAS-IP-ADDRESS]:/DATASTORE-OKAY on /mnt/NAS/DATASTORE-OKAY type nfs4 (rw,relatime,vers=4.2,rsize=1048576,wsize=1048576,namlen=255,hard,proto=tcp,timeo=600,retrans=2,sec=sys,clientaddr=172.21.111.220,local_lock=none,addr=[NAS-IP-ADDRESS])

Could you please help me, where should I look for the error?
 
Last edited:
Hello!

Today morning: "SLOW" garbage collection takes 7h and 15 minutes...

I've checked: copy from NFS mount to local SSD is very fast, I/O is absolutely ok.

Here is a log from the "OKAY" GC:

Code:
2023-10-27T00:00:00+02:00: starting garbage collection on store DATASTORE-OKAY
2023-10-27T00:00:00+02:00: task triggered by schedule 'daily'
2023-10-27T00:00:00+02:00: Start GC phase1 (mark used chunks)
2023-10-27T00:00:03+02:00: marked 1% (1 of 63 index files)
2023-10-27T00:00:03+02:00: marked 3% (2 of 63 index files)
2023-10-27T00:00:05+02:00: marked 4% (3 of 63 index files)
2023-10-27T00:00:05+02:00: marked 6% (4 of 63 index files)
2023-10-27T00:00:08+02:00: marked 7% (5 of 63 index files)
2023-10-27T00:00:08+02:00: marked 9% (6 of 63 index files)
2023-10-27T00:00:11+02:00: marked 11% (7 of 63 index files)
2023-10-27T00:00:11+02:00: marked 12% (8 of 63 index files)
2023-10-27T00:00:11+02:00: marked 14% (9 of 63 index files)
2023-10-27T00:00:14+02:00: marked 15% (10 of 63 index files)
2023-10-27T00:00:14+02:00: marked 17% (11 of 63 index files)
2023-10-27T00:00:16+02:00: marked 19% (12 of 63 index files)
2023-10-27T00:00:19+02:00: marked 20% (13 of 63 index files)
2023-10-27T00:00:19+02:00: marked 22% (14 of 63 index files)
2023-10-27T00:00:22+02:00: marked 23% (15 of 63 index files)
2023-10-27T00:00:22+02:00: marked 25% (16 of 63 index files)
2023-10-27T00:00:25+02:00: marked 26% (17 of 63 index files)
2023-10-27T00:00:25+02:00: marked 28% (18 of 63 index files)
2023-10-27T00:00:25+02:00: marked 30% (19 of 63 index files)
2023-10-27T00:00:28+02:00: marked 31% (20 of 63 index files)
2023-10-27T00:00:28+02:00: marked 33% (21 of 63 index files)
2023-10-27T00:00:31+02:00: marked 34% (22 of 63 index files)
2023-10-27T00:00:31+02:00: marked 36% (23 of 63 index files)
2023-10-27T00:00:33+02:00: marked 38% (24 of 63 index files)
2023-10-27T00:00:36+02:00: marked 39% (25 of 63 index files)
2023-10-27T00:00:36+02:00: marked 41% (26 of 63 index files)
2023-10-27T00:00:39+02:00: marked 42% (27 of 63 index files)
2023-10-27T00:00:39+02:00: marked 44% (28 of 63 index files)
2023-10-27T00:00:42+02:00: marked 46% (29 of 63 index files)
2023-10-27T00:00:42+02:00: marked 47% (30 of 63 index files)
2023-10-27T00:00:44+02:00: marked 49% (31 of 63 index files)
2023-10-27T00:00:44+02:00: marked 50% (32 of 63 index files)
2023-10-27T00:00:47+02:00: marked 52% (33 of 63 index files)
2023-10-27T00:00:47+02:00: marked 53% (34 of 63 index files)
2023-10-27T00:00:47+02:00: marked 55% (35 of 63 index files)
2023-10-27T00:00:50+02:00: marked 57% (36 of 63 index files)
2023-10-27T00:00:50+02:00: marked 58% (37 of 63 index files)
2023-10-27T00:00:53+02:00: marked 60% (38 of 63 index files)
2023-10-27T00:00:55+02:00: marked 61% (39 of 63 index files)
2023-10-27T00:00:55+02:00: marked 63% (40 of 63 index files)
2023-10-27T00:00:58+02:00: marked 65% (41 of 63 index files)
2023-10-27T00:00:58+02:00: marked 66% (42 of 63 index files)
2023-10-27T00:01:24+02:00: marked 68% (43 of 63 index files)
2023-10-27T00:01:49+02:00: marked 69% (44 of 63 index files)
2023-10-27T00:02:14+02:00: marked 71% (45 of 63 index files)
2023-10-27T00:02:39+02:00: marked 73% (46 of 63 index files)
2023-10-27T00:03:04+02:00: marked 74% (47 of 63 index files)
2023-10-27T00:03:29+02:00: marked 76% (48 of 63 index files)
2023-10-27T00:03:54+02:00: marked 77% (49 of 63 index files)
2023-10-27T00:04:19+02:00: marked 79% (50 of 63 index files)
2023-10-27T00:04:44+02:00: marked 80% (51 of 63 index files)
2023-10-27T00:05:09+02:00: marked 82% (52 of 63 index files)
2023-10-27T00:05:34+02:00: marked 84% (53 of 63 index files)
2023-10-27T00:06:00+02:00: marked 85% (54 of 63 index files)
2023-10-27T00:06:25+02:00: marked 87% (55 of 63 index files)
2023-10-27T00:06:50+02:00: marked 88% (56 of 63 index files)
2023-10-27T00:07:15+02:00: marked 90% (57 of 63 index files)
2023-10-27T00:07:40+02:00: marked 92% (58 of 63 index files)
2023-10-27T00:08:05+02:00: marked 93% (59 of 63 index files)
2023-10-27T00:08:30+02:00: marked 95% (60 of 63 index files)
2023-10-27T00:08:55+02:00: marked 96% (61 of 63 index files)
2023-10-27T00:09:20+02:00: marked 98% (62 of 63 index files)
2023-10-27T00:09:46+02:00: marked 100% (63 of 63 index files)
2023-10-27T00:09:46+02:00: Start GC phase2 (sweep unused chunks)
2023-10-27T00:09:46+02:00: processed 1% (349 chunks)
.....
2023-10-27T00:10:05+02:00: processed 99% (32869 chunks)
2023-10-27T00:10:05+02:00: Removed garbage: 0 B
2023-10-27T00:10:05+02:00: Removed chunks: 0
2023-10-27T00:10:05+02:00: Pending removals: 1.816 MiB (in 1 chunks)
2023-10-27T00:10:05+02:00: Original data usage: 759.103 GiB
2023-10-27T00:10:05+02:00: On-Disk usage: 20.902 GiB (2.75%)
2023-10-27T00:10:05+02:00: On-Disk chunks: 33194
2023-10-27T00:10:05+02:00: Deduplication factor: 36.32
2023-10-27T00:10:05+02:00: Average chunk size: 660.271 KiB
2023-10-27T00:10:05+02:00: TASK OK

And here is a log from the "SLOW" GC:

Code:
2023-10-27T00:30:00+02:00: starting garbage collection on store DATASTORE-SLOW
2023-10-27T00:30:00+02:00: task triggered by schedule '00:30'
2023-10-27T00:30:00+02:00: Start GC phase1 (mark used chunks)
2023-10-27T00:49:40+02:00: marked 3% (1 of 33 index files)
2023-10-27T01:09:16+02:00: marked 6% (2 of 33 index files)
2023-10-27T01:28:53+02:00: marked 9% (3 of 33 index files)
2023-10-27T01:48:27+02:00: marked 12% (4 of 33 index files)
2023-10-27T02:08:03+02:00: marked 15% (5 of 33 index files)
2023-10-27T02:18:29+02:00: marked 18% (6 of 33 index files)
2023-10-27T02:38:03+02:00: marked 21% (7 of 33 index files)
2023-10-27T02:48:30+02:00: marked 24% (8 of 33 index files)
2023-10-27T03:08:07+02:00: marked 27% (9 of 33 index files)
2023-10-27T03:27:41+02:00: marked 30% (10 of 33 index files)
2023-10-27T03:47:16+02:00: marked 33% (11 of 33 index files)
2023-10-27T04:07:18+02:00: marked 36% (12 of 33 index files)
2023-10-27T04:08:52+02:00: marked 39% (13 of 33 index files)
2023-10-27T04:10:26+02:00: marked 42% (14 of 33 index files)
2023-10-27T04:30:29+02:00: marked 45% (15 of 33 index files)
2023-10-27T04:32:03+02:00: marked 48% (16 of 33 index files)
2023-10-27T04:52:06+02:00: marked 51% (17 of 33 index files)
2023-10-27T05:12:09+02:00: marked 54% (18 of 33 index files)
2023-10-27T05:13:43+02:00: marked 57% (19 of 33 index files)
2023-10-27T05:33:46+02:00: marked 60% (20 of 33 index files)
2023-10-27T05:35:20+02:00: marked 63% (21 of 33 index files)
2023-10-27T05:36:54+02:00: marked 66% (22 of 33 index files)
2023-10-27T05:56:57+02:00: marked 69% (23 of 33 index files)
2023-10-27T05:58:31+02:00: marked 72% (24 of 33 index files)
2023-10-27T06:18:33+02:00: marked 75% (25 of 33 index files)
2023-10-27T06:20:07+02:00: marked 78% (26 of 33 index files)
2023-10-27T06:40:10+02:00: marked 81% (27 of 33 index files)
2023-10-27T07:00:13+02:00: marked 84% (28 of 33 index files)
2023-10-27T07:01:47+02:00: marked 87% (29 of 33 index files)
2023-10-27T07:21:50+02:00: marked 90% (30 of 33 index files)
2023-10-27T07:23:24+02:00: marked 93% (31 of 33 index files)
2023-10-27T07:43:25+02:00: marked 96% (32 of 33 index files)
2023-10-27T07:45:00+02:00: marked 100% (33 of 33 index files)
2023-10-27T07:45:00+02:00: Start GC phase2 (sweep unused chunks)
2023-10-27T07:45:00+02:00: processed 1% (138 chunks)
.....
2023-10-27T07:45:18+02:00: processed 99% (14672 chunks)
2023-10-27T07:45:18+02:00: Removed garbage: 0 B
2023-10-27T07:45:18+02:00: Removed chunks: 0
2023-10-27T07:45:18+02:00: Pending removals: 456.086 KiB (in 3 chunks)
2023-10-27T07:45:18+02:00: Original data usage: 32.535 TiB
2023-10-27T07:45:18+02:00: On-Disk usage: 11.505 GiB (0.03%)
2023-10-27T07:45:18+02:00: On-Disk chunks: 14829
2023-10-27T07:45:18+02:00: Deduplication factor: 2895.88
2023-10-27T07:45:18+02:00: Average chunk size: 813.504 KiB
2023-10-27T07:45:18+02:00: TASK OK

Note the ~20 minute gaps between "GC phase1 (mark used chunks)" rows! What's this?
 
the only thing that comes to mind could be the default ordering of the chunks

by default, we try to order the chunks by their inode number (which usually improves the throughput, since the files get accessed in the order on disk) but in your case it may reduce performance if you have very big indices (which is indicated by the bit 'Original data usage' but only 33 indices.

you can turn that off per datastore with the tuning parameter in Datastore -> options -> tuning -> chunk order

EDIT: i forgot: that would not explain why the garbage collection would take longer each time (except if there are more backups each time)
EDIT2: seems i misremembered, and we don't use that at all for the garbage collection....
 
Last edited:
Hello Dominik!

Sorry, I just got around to it. Unfortunately, it didn't help. Here are the results:

"OKAY" datastore (it is not OK, it's also slowing down):

Code:
Index file count:     108

Removed garbage:      0 B
Removed chunks:       0
Removed bad chunks:   0

Leftover bad chunks:  0
Pending removals:     1.816 MiB (in 1 chunks)

Original Data usage:  1.272 TiB
On-Disk usage:        29.678 GiB (2.28%)
On-Disk chunks:       51484

Run time: ~50 minutes

"SLOW" datastore:

Code:
Index file count:     37

Removed garbage:      0 B
Removed chunks:       0
Removed bad chunks:   0

Leftover bad chunks:  0
Pending removals:     456.086 KiB (in 3 chunks)

Original Data usage:  37.027 TiB
On-Disk usage:        12.794 GiB (0.03%)
On-Disk chunks:       16380

Run time: ~8 hours and 45 minutes
 
On two servers I've had a similar case. The remedy was to simply reboot the backup server.
I've tried debugging why the slowness before and after rebooting, but I couldn't find out.
For now they're both working fast enough (i.e. tens of minutes instead of tens of hours)
 
On two servers I've had a similar case. The remedy was to simply reboot the backup server.
I've tried debugging why the slowness before and after rebooting, but I couldn't find out.
For now they're both working fast enough (i.e. tens of minutes instead of tens of hours)
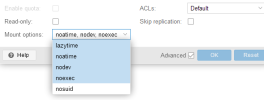
I'll try t. Do you use NFS mounts as a target, like me? If yes, can you send me the NFS mount parameters?
 
I'll try t. Do you use NFS mounts as a target, like me? If yes, can you send me the NFS mount parameters?

ACLs: Default
Mount options: lazytime, noatime, nodev, noexec

1699704111769.png

Edit, A few days later:
I noticed you asked about NFS mounts, not partition mounts. I don't use that, unfortunately.
 
Last edited:
PBS needs atime...
Yes, I remember studying this thoroughly and reaching to the conclusion to use the options above.
Unfortunately my memory isn't more helpful at the moment. But if I remember the details I'll share them here.
 
What a GC is basically doing:
Phase 1: update the atime of all chunks
Phase 2: destroy all chunks where the atime is older than 24 hours and 5 minutes
So "relatime" would be fine, where it updates the atime every 24 hours, "noatime" not where it won't update the atime at all. Therefore "noatime" can cause dataloss as the GC then could delete chunks that are actually still needed.
 
Last edited:

About

The Proxmox community has been around for many years and offers help and support for Proxmox VE, Proxmox Backup Server, and Proxmox Mail Gateway.
We think our community is one of the best thanks to people like you!

Get your subscription!

The Proxmox team works very hard to make sure you are running the best software and getting stable updates and security enhancements, as well as quick enterprise support. Tens of thousands of happy customers have a Proxmox subscription. Get yours easily in our online shop.

Buy now!