Hello
I installed proxmox monitoring using influx and I also installed dashboard from internet (https://grafana.com/grafana/dashboards/10048)
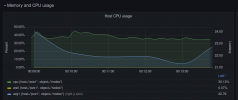
Can anyone explain this panel for me (Host cpu usage)
I installed proxmox monitoring using influx and I also installed dashboard from internet (https://grafana.com/grafana/dashboards/10048)
Can anyone explain this panel for me (Host cpu usage)