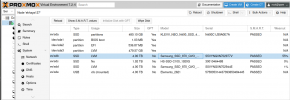
I have LVM thin provisioned on a 1 TB WD Blue SSD. In use for about 10 months and has, until recently, always reported 0% Wearout in PVE web UI.
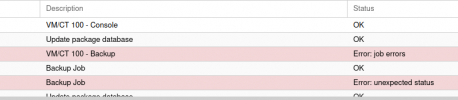
Recently, this has jumped to 98%! The disk is puportedly good for 400TBW and I don't believe I have over taxed it. It's about 25% capacity, I have done a few dozen VM/CT restores from snapshots and backups, but nothing beyond a normal home lab workload IMO. All the VM's have modest disk size/write requirements.
AIUI, disk wearout reported in PVE Web UI is `100 - Media_Wearout_Indicator`. However, since monitoring started (shortly after installation) this value has mostly been 1, rising recently to 2. PVE UI has reported 0% Wearout until very recently. What has increased steadily, albeit with a few jumps, is the raw value of said attribute. I have no idea what the raw value actually represents or how the attribute value (currently 2) relates to it.
So, I'm wondering is the disk really near end of life already and how do we interpret that raw value (0x020b0032020b)?
I'd be grateful for any insight and advice on the state of the SSD!
Many thanks.
smartctl currently reports:
Code:
smartctl 7.1 2019-12-30 r5022 [x86_64-linux-5.4.73-1-pve] (local build)
Copyright (C) 2002-19, Bruce Allen, Christian Franke, www.smartmontools.org

=== START OF INFORMATION SECTION ===
Model Family:     WD Blue and Green SSDs
Device Model:     WDC  WDS100T2B0A-00SM50
Serial Number:    194526801184
LU WWN Device Id: 5 001b44 8b1149bcb
Firmware Version: 411030WD
User Capacity:    1,000,204,886,016 bytes [1.00 TB]
Sector Size:      512 bytes logical/physical
Rotation Rate:    Solid State Device
Form Factor:      2.5 inches
Device is:        In smartctl database [for details use: -P show]
ATA Version is:   ACS-4 T13/BSR INCITS 529 revision 5
SATA Version is:  SATA 3.3, 6.0 Gb/s (current: 6.0 Gb/s)
Local Time is:    Sun Nov 29 14:17:08 2020 GMT
SMART support is: Available - device has SMART capability.
SMART support is: Enabled

=== START OF READ SMART DATA SECTION ===
SMART overall-health self-assessment test result: PASSED

General SMART Values:
Offline data collection status:  (0x00)    Offline data collection activity
                    was never started.
                    Auto Offline Data Collection: Disabled.
Self-test execution status:      (   0)    The previous self-test routine completed
                    without error or no self-test has ever
                    been run.
Total time to complete Offline
data collection:         (    0) seconds.
Offline data collection
capabilities:              (0x11) SMART execute Offline immediate.
                    No Auto Offline data collection support.
                    Suspend Offline collection upon new
                    command.
                    No Offline surface scan supported.
                    Self-test supported.
                    No Conveyance Self-test supported.
                    No Selective Self-test supported.
SMART capabilities:            (0x0003)    Saves SMART data before entering
                    power-saving mode.
                    Supports SMART auto save timer.
Error logging capability:        (0x01)    Error logging supported.
                    General Purpose Logging supported.
Short self-test routine
recommended polling time:      (   2) minutes.
Extended self-test routine
recommended polling time:      (  10) minutes.

SMART Attributes Data Structure revision number: 4
Vendor Specific SMART Attributes with Thresholds:
ID# ATTRIBUTE_NAME          FLAG     VALUE WORST THRESH TYPE      UPDATED  WHEN_FAILED RAW_VALUE
  5 Reallocated_Sector_Ct   0x0032   100   100   ---    Old_age   Always       -       0
  9 Power_On_Hours          0x0032   100   100   ---    Old_age   Always       -       7526
 12 Power_Cycle_Count       0x0032   100   100   ---    Old_age   Always       -       124
165 Block_Erase_Count       0x0032   100   100   ---    Old_age   Always       -       102106146
166 Minimum_PE_Cycles_TLC   0x0032   100   100   ---    Old_age   Always       -       1
167 Max_Bad_Blocks_per_Die  0x0032   100   100   ---    Old_age   Always       -       72
168 Maximum_PE_Cycles_TLC   0x0032   100   100   ---    Old_age   Always       -       14
169 Total_Bad_Blocks        0x0032   100   100   ---    Old_age   Always       -       609
170 Grown_Bad_Blocks        0x0032   100   100   ---    Old_age   Always       -       0
171 Program_Fail_Count      0x0032   100   100   ---    Old_age   Always       -       0
172 Erase_Fail_Count        0x0032   100   100   ---    Old_age   Always       -       0
173 Average_PE_Cycles_TLC   0x0032   100   100   ---    Old_age   Always       -       5
174 Unexpected_Power_Loss   0x0032   100   100   ---    Old_age   Always       -       1
184 End-to-End_Error        0x0032   100   100   ---    Old_age   Always       -       0
187 Reported_Uncorrect      0x0032   100   100   ---    Old_age   Always       -       0
188 Command_Timeout         0x0032   100   100   ---    Old_age   Always       -       0
194 Temperature_Celsius     0x0022   071   040   ---    Old_age   Always       -       29 (Min/Max 14/40)
199 UDMA_CRC_Error_Count    0x0032   100   100   ---    Old_age   Always       -       0
230 Media_Wearout_Indicator 0x0032   002   002   ---    Old_age   Always       -       0x020b0032020b
232 Available_Reservd_Space 0x0033   100   100   004    Pre-fail  Always       -       100
233 NAND_GB_Written_TLC     0x0032   100   100   ---    Old_age   Always       -       5542
234 NAND_GB_Written_SLC     0x0032   100   100   ---    Old_age   Always       -       16535
241 Host_Writes_GiB         0x0030   253   253   ---    Old_age   Offline      -       13958
242 Host_Reads_GiB          0x0030   253   253   ---    Old_age   Offline      -       8508
244 Temp_Throttle_Status    0x0032   000   100   ---    Old_age   Always       -       0

SMART Error Log Version: 1
No Errors Logged

SMART Self-test log structure revision number 1
Num  Test_Description    Status                  Remaining  LifeTime(hours)  LBA_of_first_error
# 1  Short offline       Completed without error       00%      7515         -
# 2  Short offline       Completed without error       00%      7491         -
# 3  Short offline       Completed without error       00%      7467         -
# 4  Extended offline    Completed without error       00%      7445         -
# 5  Short offline       Completed without error       00%      7421         -
# 6  Short offline       Completed without error       00%      7397         -
# 7  Short offline       Completed without error       00%      7373         -
# 8  Short offline       Completed without error       00%      7348         -
# 9  Short offline       Completed without error       00%      7324         -
#10  Short offline       Completed without error       00%      7300         -
#11  Extended offline    Completed without error       00%      7276         -
#12  Short offline       Completed without error       00%      7252         -
#13  Short offline       Completed without error       00%      7228         -
#14  Short offline       Completed without error       00%      7204         -
#15  Short offline       Completed without error       00%      7180         -
#16  Short offline       Completed without error       00%      7156         -
#17  Short offline       Completed without error       00%      7132         -
#18  Extended offline    Completed without error       00%      7108         -
#19  Short offline       Completed without error       00%      7084         -
#20  Short offline       Completed without error       00%      7059         -
#21  Short offline       Completed without error       00%      7035         -

Selective Self-tests/Logging not supported