

So, I made a thing.
I've wanted something like this for a while, and got tired of using
Enter Claude.
And now: https://github.com/grioghar/proxmox-disk-io
If you like this, please star it. I have to have 1,000 stars to get it on Community Scripts.
I'll happily answer questions.
I asked Claude to write up a quick summary, with images. Here's what he had to say about it:
Disk I/O panel for the PVE web UI — who is actually using the disks
Proxmox will tell you a disk is busy. It will not tell you what is making it busy.
I got tired of guessing, so I built this: a live disk I/O panel that goes into the web UI under Node -> Disks -> I/O Activity. Per physical disk it shows throughput, IOPS, utilisation, latency and queue depth, and names the container or VM driving each one.
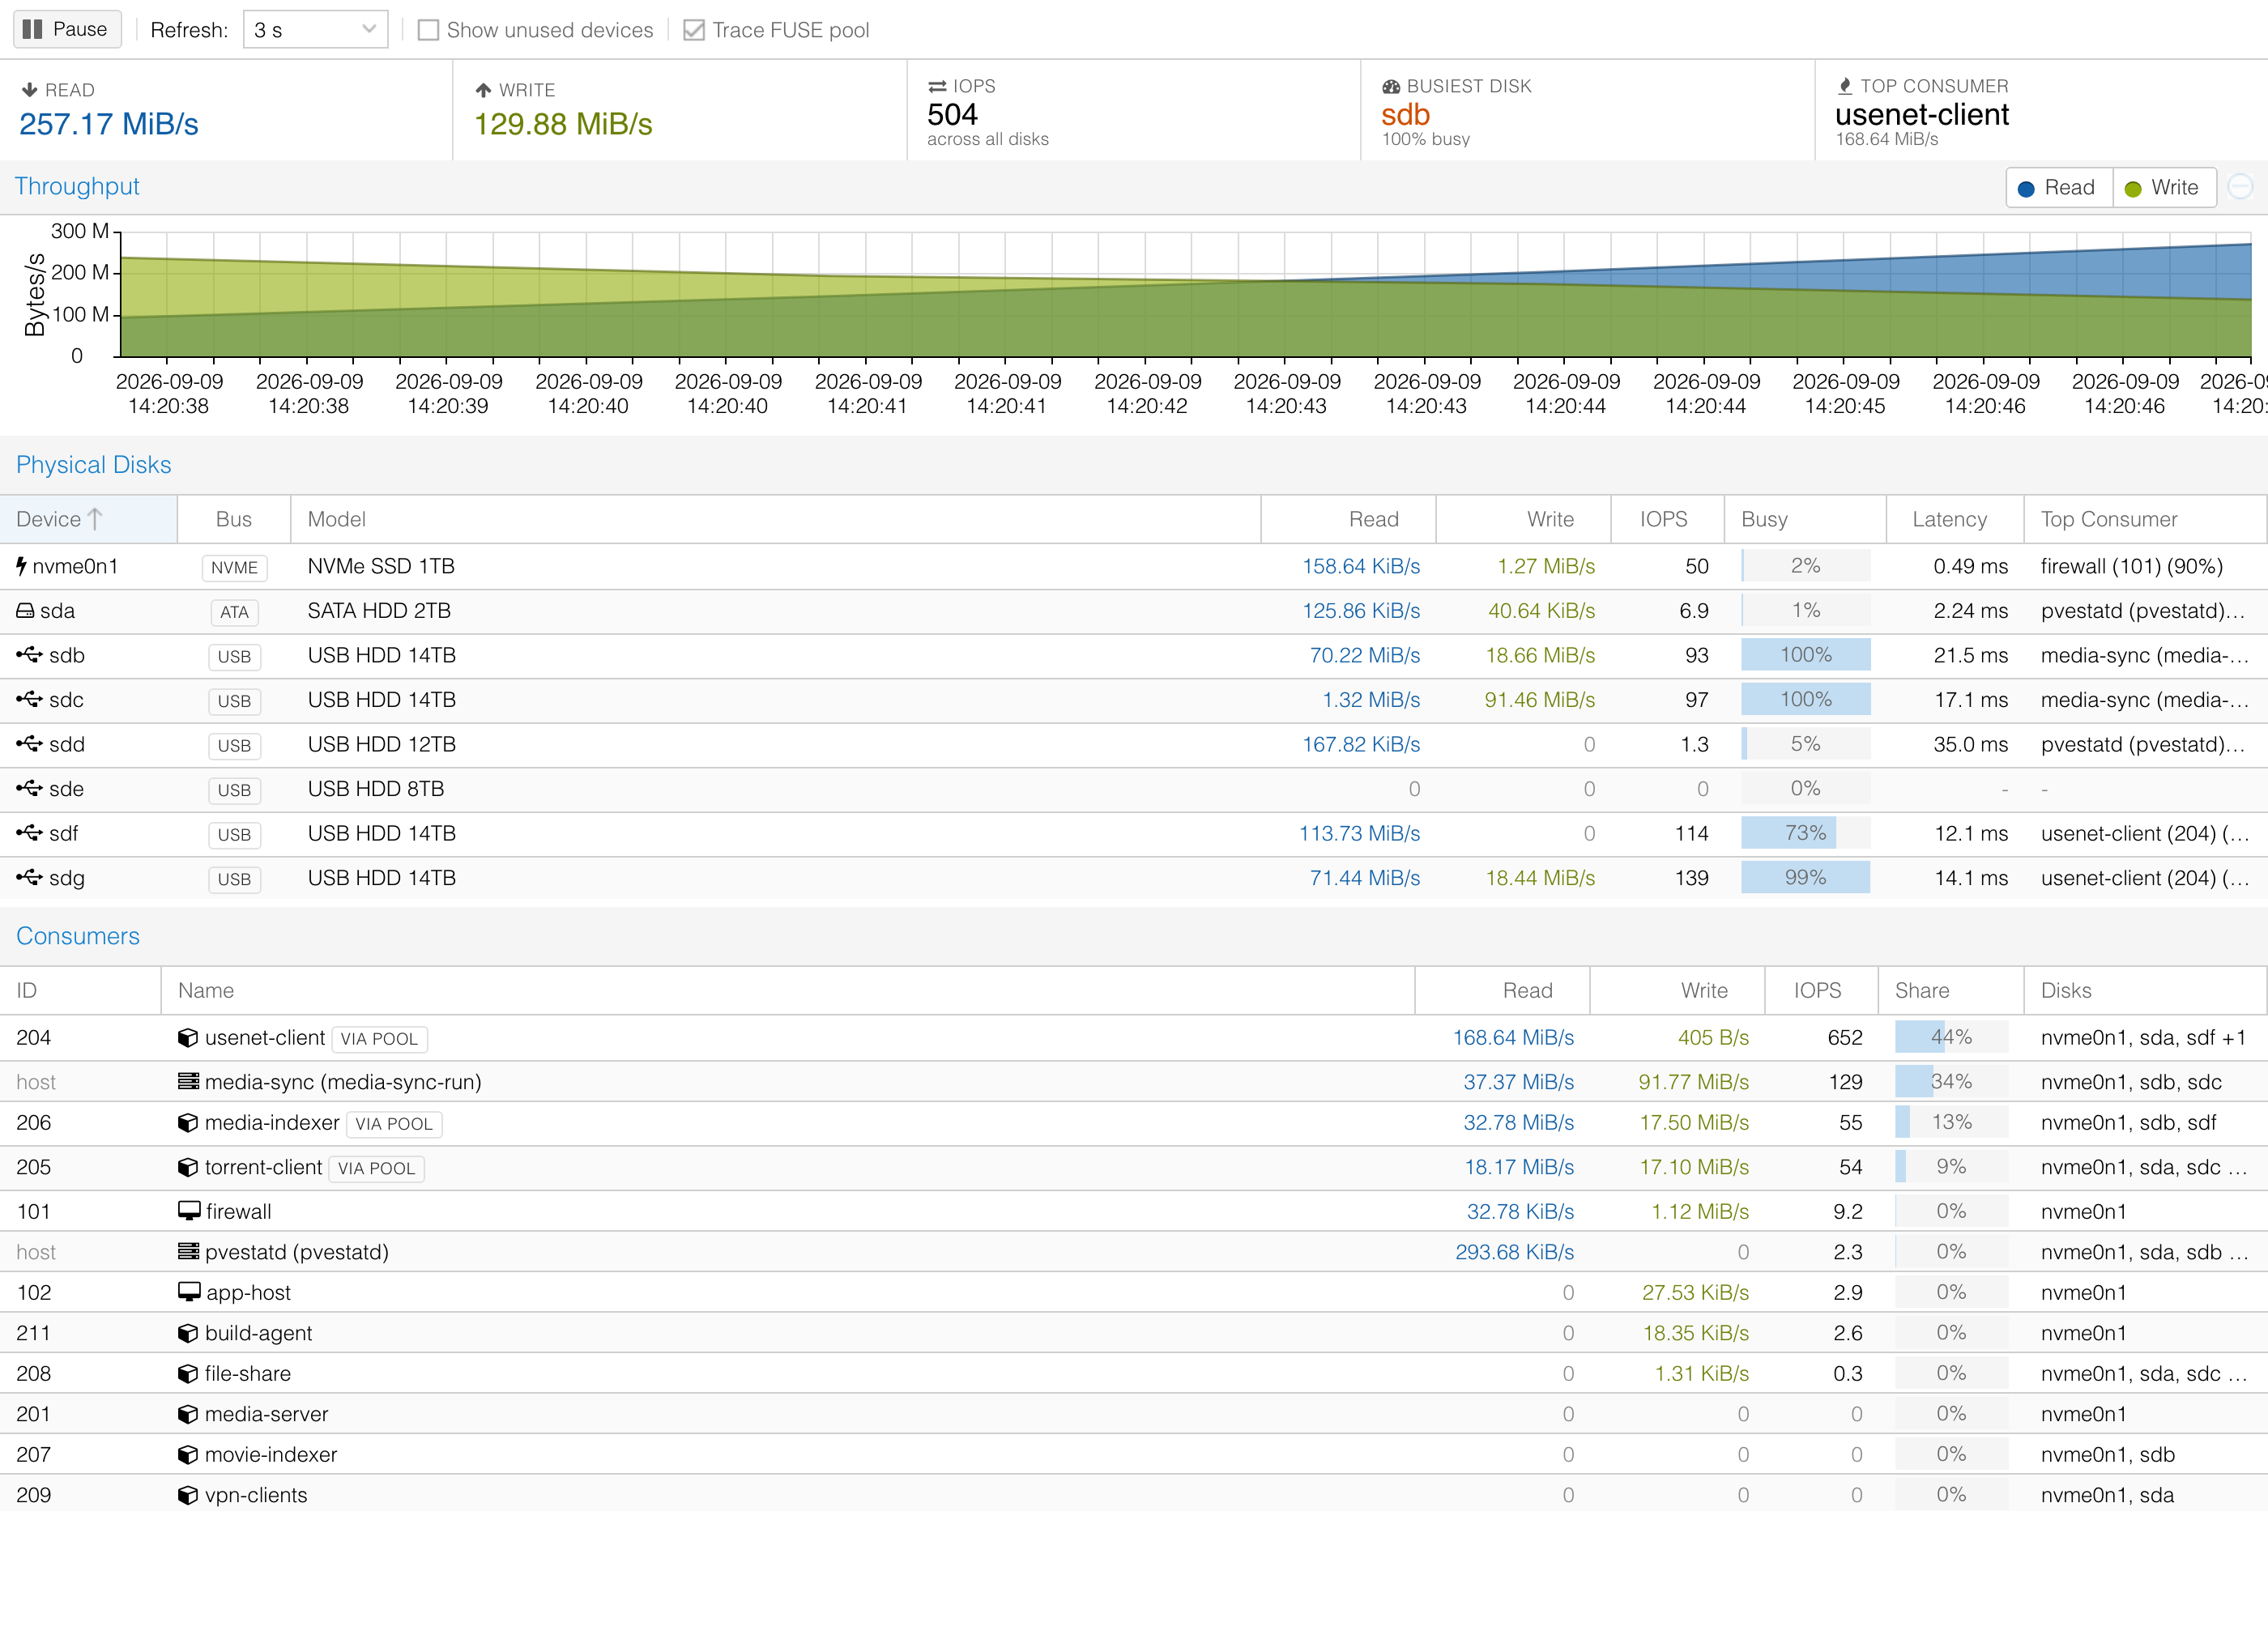
Utilisation is the real thing, derived from io_ticks — the same figure iostat calls %util. Bus is shown because it usually explains the latency: in that shot the USB disks sit at 100% busy and 17–21 ms while the NVMe is at 2% and 0.49 ms.
Seeing through mergerfs / FUSE pools
This is the part I actually wrote it for.
A container writing to a mergerfs pool never touches a block device. It makes a syscall, and the mergerfs daemon — a process on the host — does the I/O. So the block layer, and every tool built on it (iotop, pidstat, Proxmox itself), credits the daemon. On a media host the one process you can see is the one you do not care about.
This treats the daemon as the passthrough it is. It is not listed as a consumer at all; its per-disk bytes are handed to the callers holding files open on the pool, so a disk's Top Consumer reads "usenet-client (204)" rather than "/mnt/pool (mergerfs)". Host processes are attributed too — a rebalance script is as much a consumer of a disk as any container.
Being straight about the accuracy: the quantity apportioned is block level, so a disk's attributed bytes still add up to what the disk really did. Only the split between callers comes from syscall counters. Once FUSE is in the middle the kernel does not record which caller each block write came from, so with several containers on one disk at once, treat the proportions as a strong approximation. Rows credited that way are tagged VIA POOL so you always know which is which.
Per guest
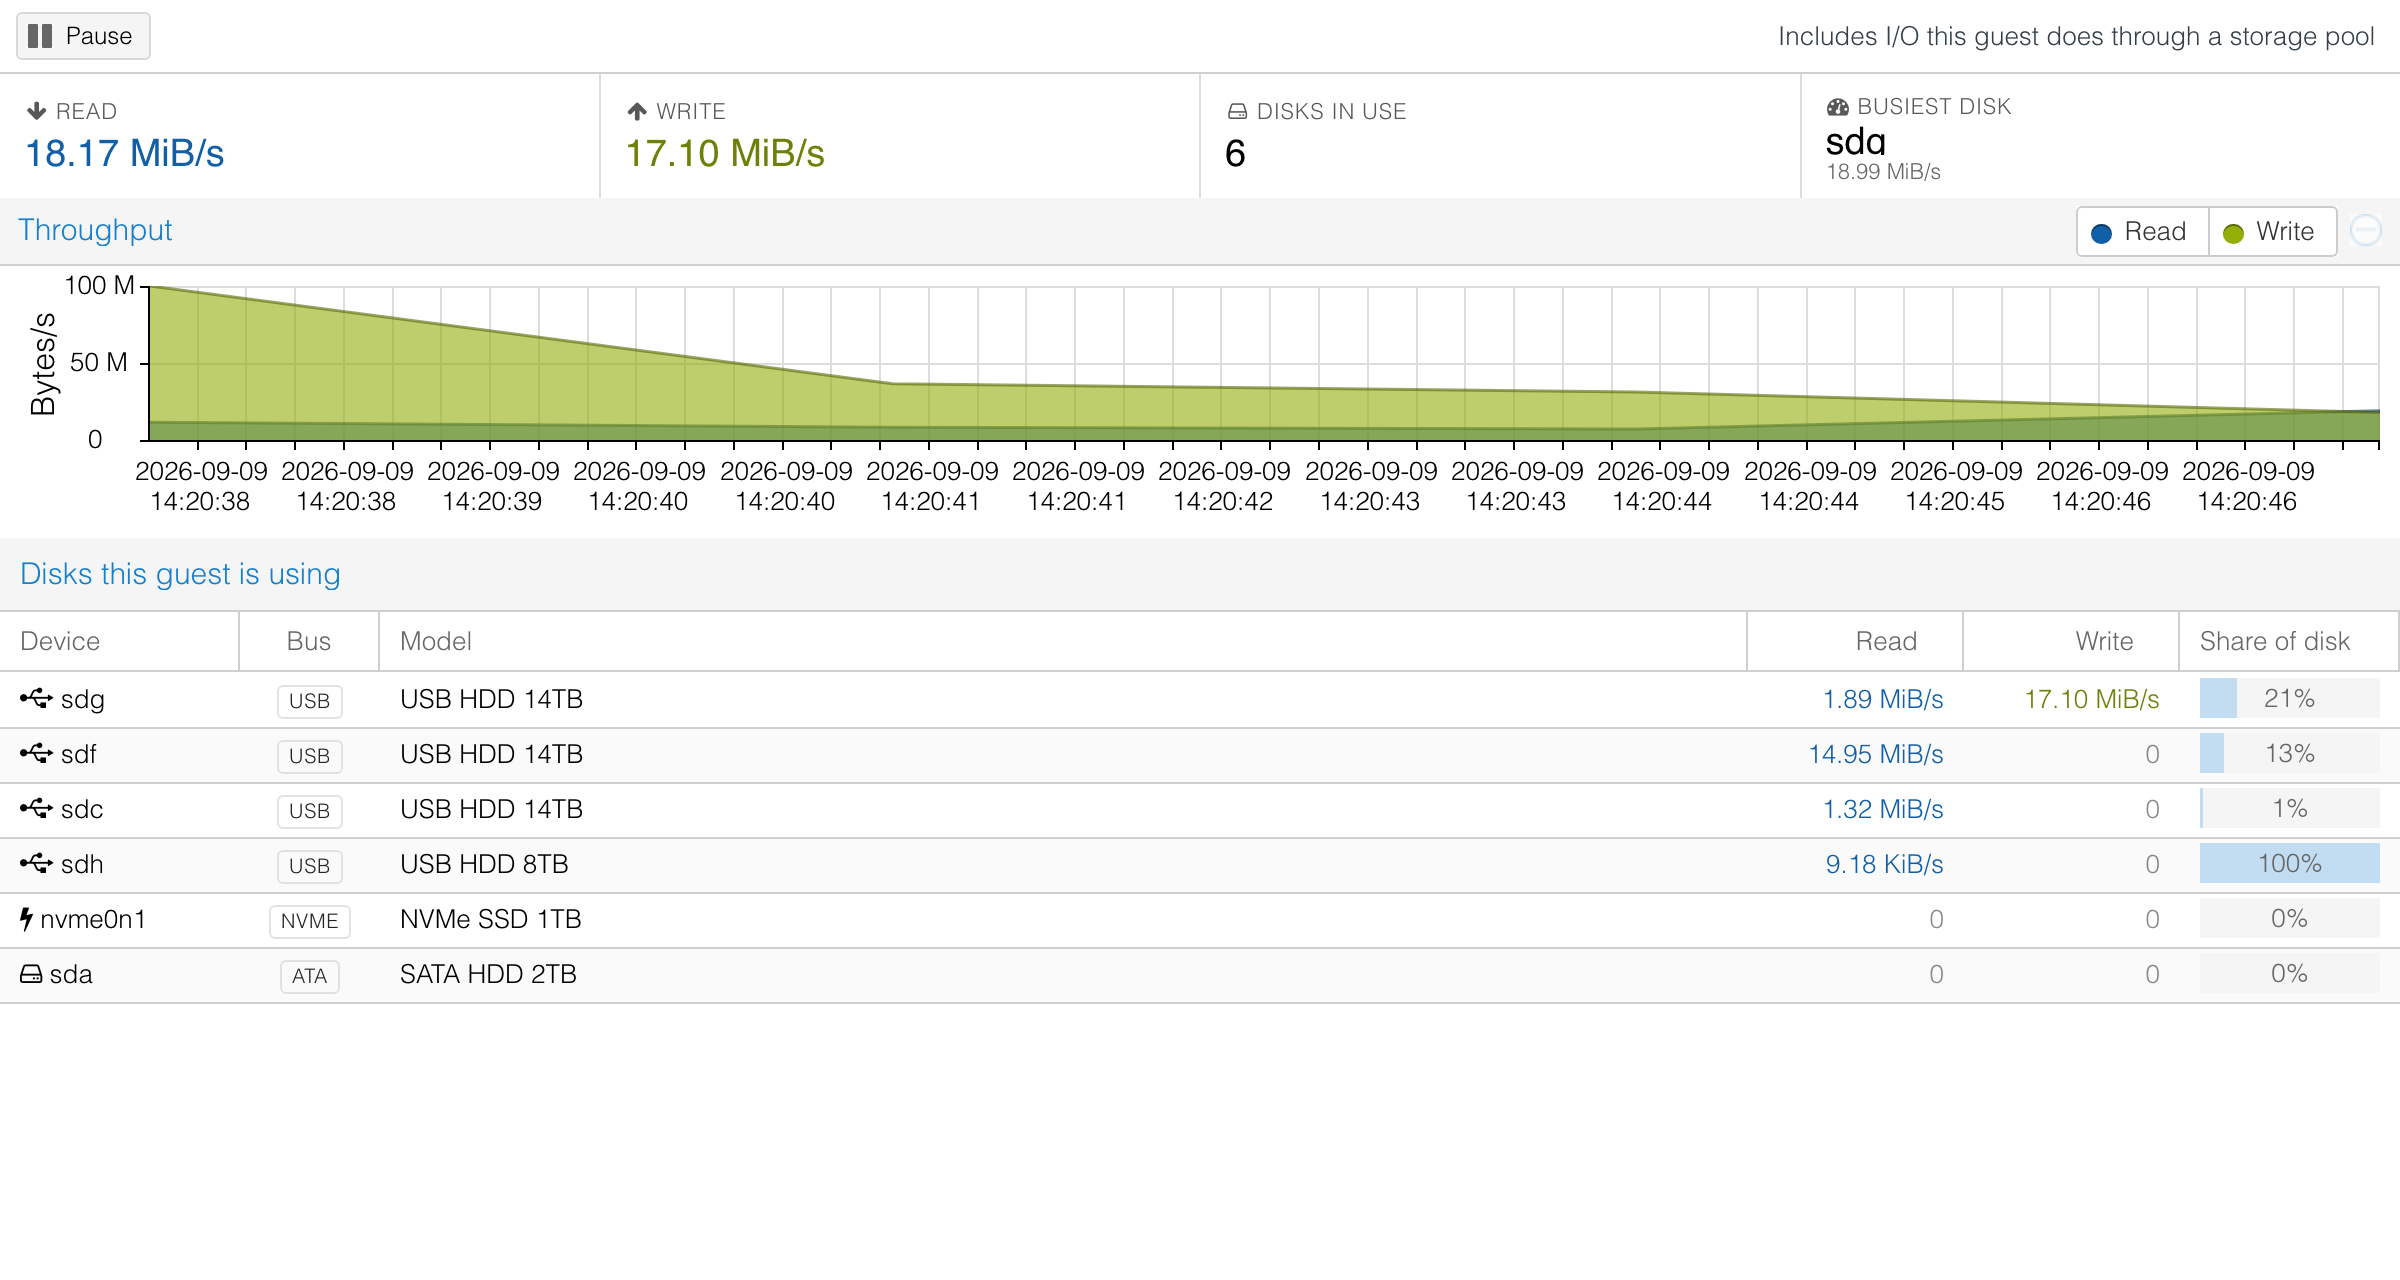
Every LXC and VM gets its own Disk I/O page. "Share of disk" is the useful column — how much of that disk's traffic is this guest.
History
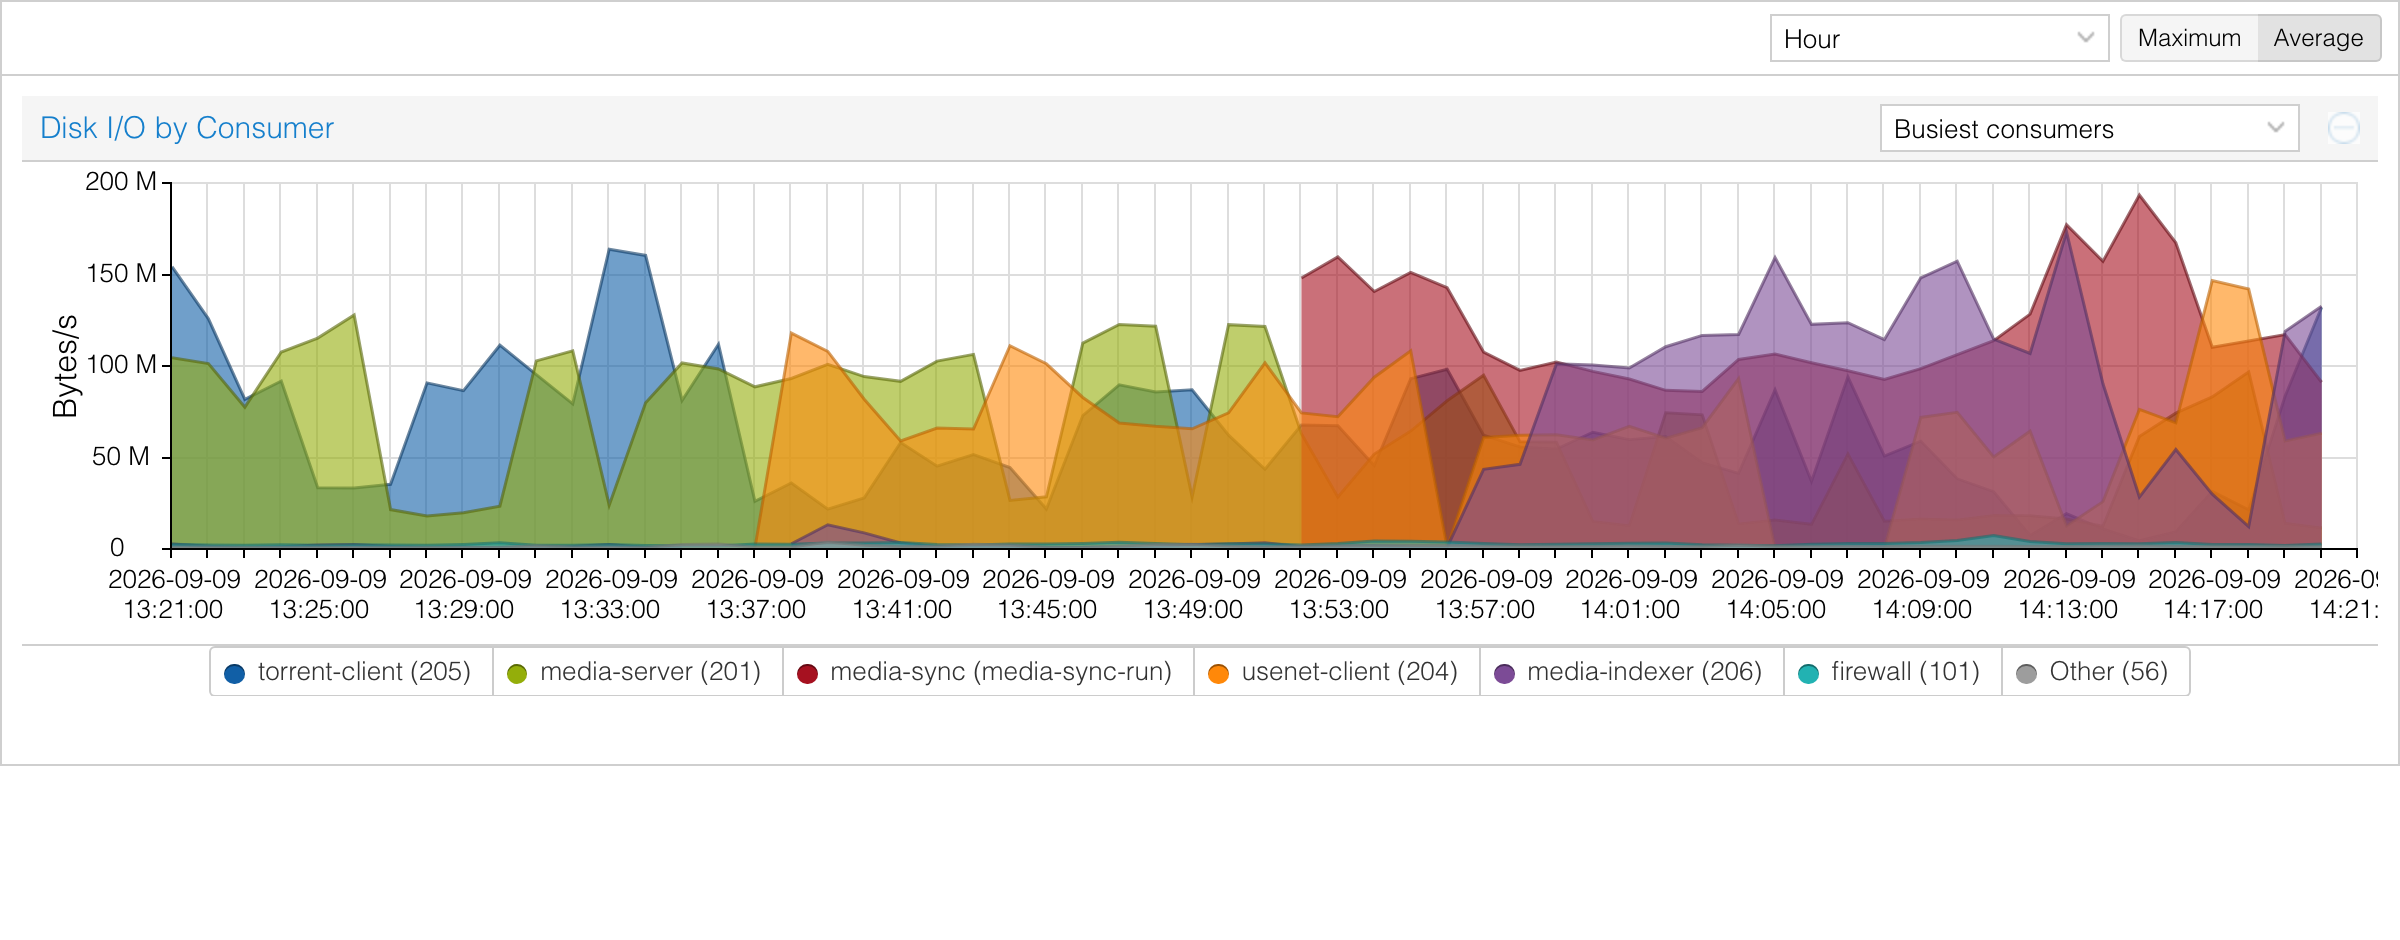
The node Summary gets per-disk and per-consumer graphs, using the same Hour/Day/Week/Month/Year selector as the stock ones, and each guest's Summary gets a per-disk breakdown. Consumers are ranked by what they did within the window on screen, so switching timeframe re-ranks.
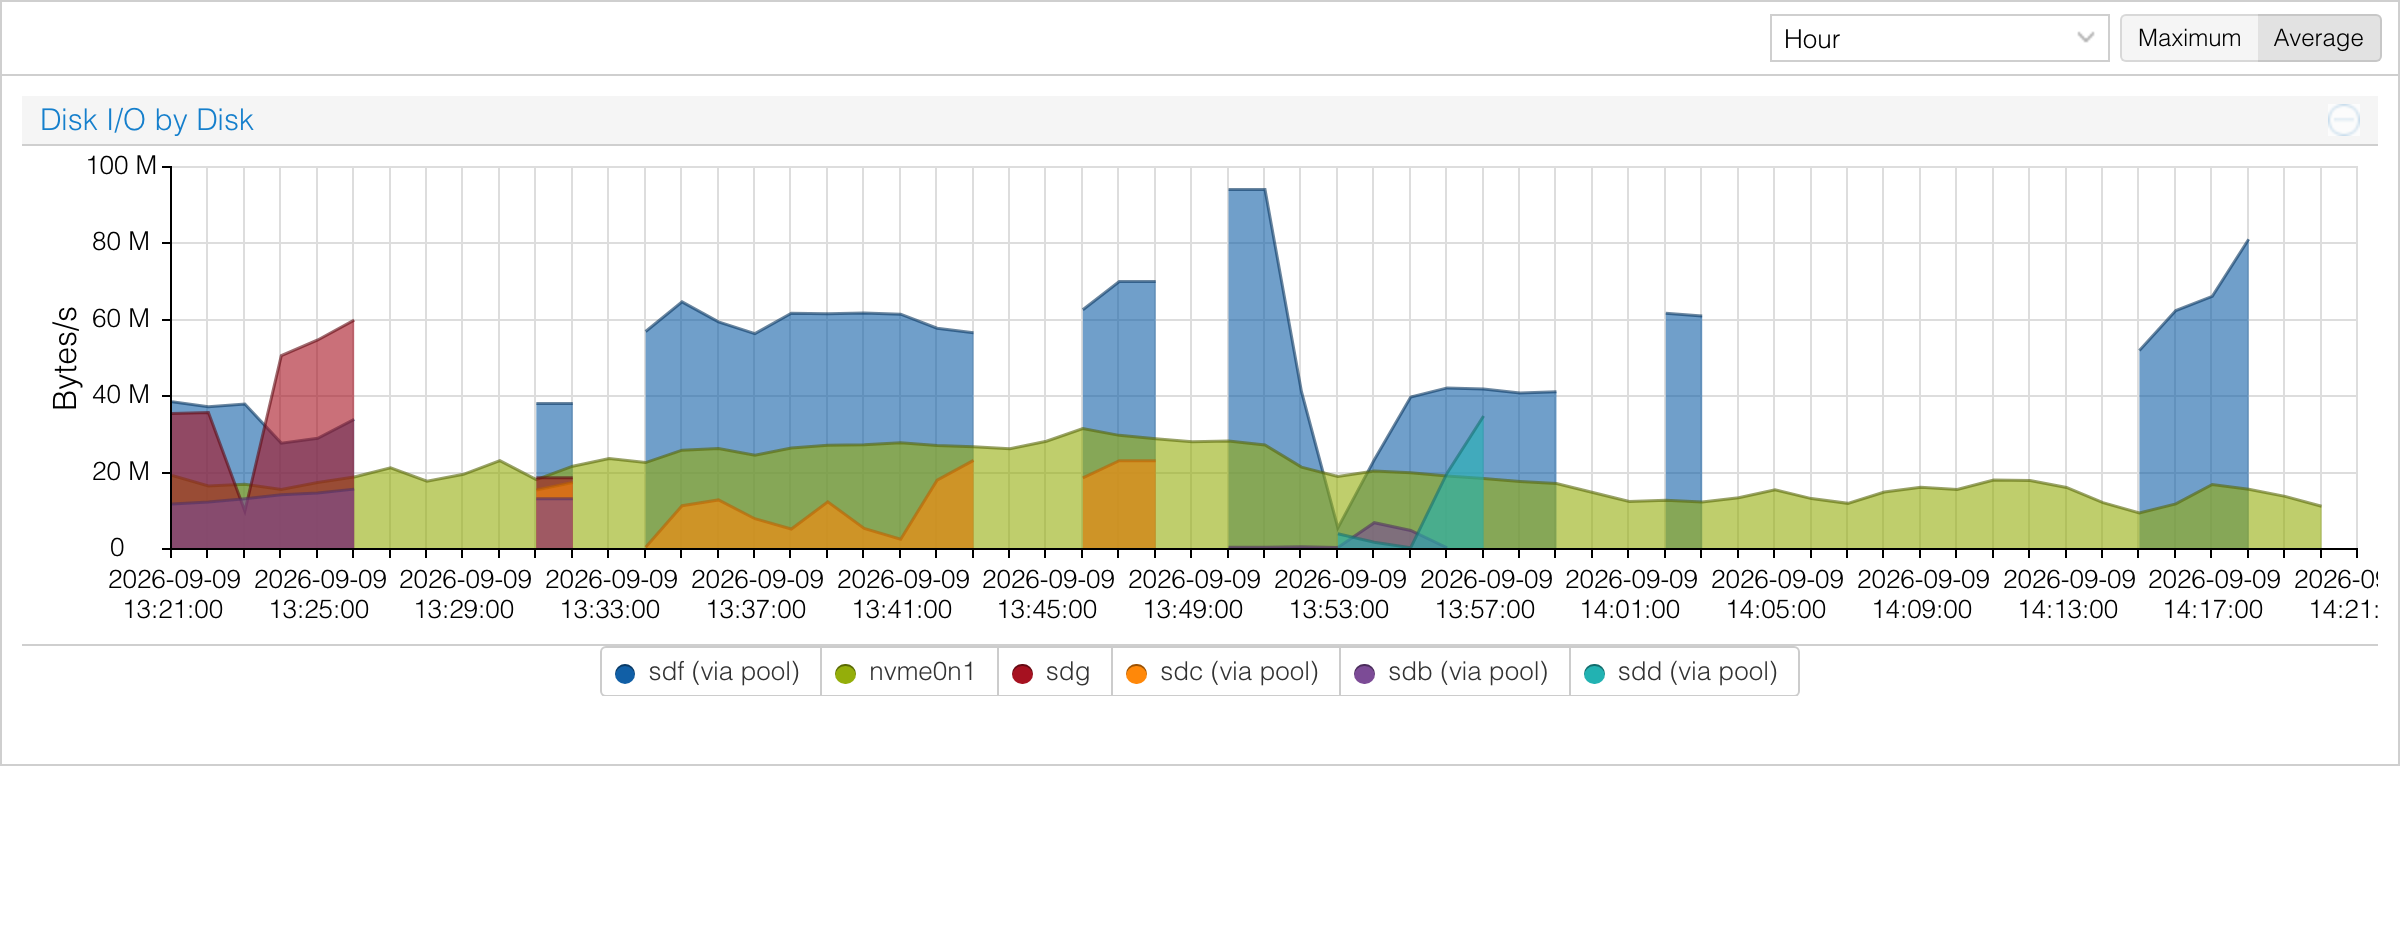
History is keyed on the drive serial, not sdX — USB enclosures reorder across reboots and I did not want history silently following whichever drive enumerated second.
What it modifies — read this bit
It is unofficial and it does edit two pve-manager-owned files:
Both edits are idempotent and both are reversed on uninstall, with pristine copies kept in /var/backups/pve-disk-io/. pvemanagerlib.js is deliberately never touched — the UI attaches itself with runtime Ext overrides — so an upgrade can remove the integration but can never leave it half-applied. The .deb carries a dpkg trigger, so a pve-manager upgrade re-applies it automatically; with the shell installer you re-run the script.
Install
Hard-reload the browser afterwards. Remove with
Costs about 60 ms per poll and only while the panel is open; the history collector runs once a minute at Nice=10 and idle I/O priority.
Repo
https://github.com/grioghar/proxmox-disk-io — MIT, tested on PVE 9.2.
Screenshots are real data from a live node with guest names and disk models anonymised. Feedback welcome, particularly from anyone running ZFS or Ceph — I have only been able to test this against LVM-thin, directory storage and mergerfs.
I've wanted something like this for a while, and got tired of using
iotop and htop. I just wanted an understanding of what was happening with my 7 disks at a glance, and be able to view the historical data along side the rest of the system.Enter Claude.
And now: https://github.com/grioghar/proxmox-disk-io
If you like this, please star it. I have to have 1,000 stars to get it on Community Scripts.
I'll happily answer questions.
I asked Claude to write up a quick summary, with images. Here's what he had to say about it:
Disk I/O panel for the PVE web UI — who is actually using the disks
Proxmox will tell you a disk is busy. It will not tell you what is making it busy.
I got tired of guessing, so I built this: a live disk I/O panel that goes into the web UI under Node -> Disks -> I/O Activity. Per physical disk it shows throughput, IOPS, utilisation, latency and queue depth, and names the container or VM driving each one.
Utilisation is the real thing, derived from io_ticks — the same figure iostat calls %util. Bus is shown because it usually explains the latency: in that shot the USB disks sit at 100% busy and 17–21 ms while the NVMe is at 2% and 0.49 ms.
Seeing through mergerfs / FUSE pools
This is the part I actually wrote it for.
A container writing to a mergerfs pool never touches a block device. It makes a syscall, and the mergerfs daemon — a process on the host — does the I/O. So the block layer, and every tool built on it (iotop, pidstat, Proxmox itself), credits the daemon. On a media host the one process you can see is the one you do not care about.
This treats the daemon as the passthrough it is. It is not listed as a consumer at all; its per-disk bytes are handed to the callers holding files open on the pool, so a disk's Top Consumer reads "usenet-client (204)" rather than "/mnt/pool (mergerfs)". Host processes are attributed too — a rebalance script is as much a consumer of a disk as any container.
Being straight about the accuracy: the quantity apportioned is block level, so a disk's attributed bytes still add up to what the disk really did. Only the split between callers comes from syscall counters. Once FUSE is in the middle the kernel does not record which caller each block write came from, so with several containers on one disk at once, treat the proportions as a strong approximation. Rows credited that way are tagged VIA POOL so you always know which is which.
Per guest
Every LXC and VM gets its own Disk I/O page. "Share of disk" is the useful column — how much of that disk's traffic is this guest.
History
The node Summary gets per-disk and per-consumer graphs, using the same Hour/Day/Week/Month/Year selector as the stock ones, and each guest's Summary gets a per-disk breakdown. Consumers are ranked by what they did within the window on screen, so switching timeframe re-ranks.
History is keyed on the drive serial, not sdX — USB enclosures reorder across reboots and I did not want history silently following whichever drive enumerated second.
What it modifies — read this bit
It is unofficial and it does edit two pve-manager-owned files:
- /usr/share/perl5/PVE/API2/Disks.pm — registers the API endpoints
- /usr/share/pve-manager/index.html.tpl — loads the panel's JavaScript
Both edits are idempotent and both are reversed on uninstall, with pristine copies kept in /var/backups/pve-disk-io/. pvemanagerlib.js is deliberately never touched — the UI attaches itself with runtime Ext overrides — so an upgrade can remove the integration but can never leave it half-applied. The .deb carries a dpkg trigger, so a pve-manager upgrade re-applies it automatically; with the shell installer you re-run the script.
Install
Code:
# Debian package (re-applies itself after a pve-manager upgrade)
wget https://github.com/grioghar/proxmox-disk-io/releases/download/v1.0.0/pve-disk-io_1.0.0_all.deb
apt install ./pve-disk-io_1.0.0_all.deb

# or from source
git clone https://github.com/grioghar/proxmox-disk-io
cd proxmox-disk-io && ./scripts/install.sh
Hard-reload the browser afterwards. Remove with
apt remove pve-disk-io or ./scripts/uninstall.sh; recorded history is kept unless you purge.Costs about 60 ms per poll and only while the panel is open; the history collector runs once a minute at Nice=10 and idle I/O priority.
Repo
https://github.com/grioghar/proxmox-disk-io — MIT, tested on PVE 9.2.
Screenshots are real data from a live node with guest names and disk models anonymised. Feedback welcome, particularly from anyone running ZFS or Ceph — I have only been able to test this against LVM-thin, directory storage and mergerfs.