Hi,
We notice on a DELL r710 IOs issues. This seems to happens once every 6 month randomly (then 2-3 month and now once a month) and require a hard reboot of the server.
VMs are slow, proxmox is slow/unresponsive.
The server is a DELL r710 on a raid 10 (PERC 6/i Integrated).
The read and write are below 1MiB/s.
Here is a example where everything is good :
INFO: 0% (514.7 MiB of 300.0 GiB) in 3s, read: 171.6 MiB/s, write: 29.6 MiB/s
INFO: 1% (3.0 GiB of 300.0 GiB) in 1m 35s, read: 27.9 MiB/s, write: 27.5 MiB/s
INFO: 2% (6.0 GiB of 300.0 GiB) in 3m 24s, read: 28.3 MiB/s, write: 27.7 MiB/s
INFO: 3% (9.0 GiB of 300.0 GiB) in 5m 21s, read: 26.2 MiB/s, write: 25.9 MiB/s
INFO: 4% (12.0 GiB of 300.0 GiB) in 7m 18s, read: 26.3 MiB/s, write: 26.1 MiB/s
INFO: 5% (15.0 GiB of 300.0 GiB) in 8m 59s, read: 30.8 MiB/s, write: 30.4 MiB/s
INFO: 6% (18.1 GiB of 300.0 GiB) in 9m 49s, read: 61.5 MiB/s, write: 61.3 MiB/s
And when there is IOs issue :
INFO: 0% (2.6 MiB of 300.0 GiB) in 3s, read: 896.0 KiB/s, write: 133.3 KiB/s
INFO: 1% (3.0 GiB of 300.0 GiB) in 1h 15m 40s, read: 692.9 KiB/s, write: 589.4 KiB/s
INFO: 2% (6.0 GiB of 300.0 GiB) in 2h 29m 30s, read: 710.1 KiB/s, write: 695.7 KiB/s
INFO: 3% (9.0 GiB of 300.0 GiB) in 3h 50m 57s, read: 643.7 KiB/s, write: 634.5 KiB/s
INFO: 4% (12.0 GiB of 300.0 GiB) in 5h 8m 10s, read: 678.9 KiB/s, write: 674.4 KiB/s
Here is a top when there is the issue :
top - 09:49:52 up 16 days, 23:47, 1 user, load average: 2.23, 2.53, 2.32
Tasks: 370 total, 1 running, 369 sleeping, 0 stopped, 0 zombie
%Cpu(s): 4.9 us, 0.7 sy, 0.0 ni, 90.1 id, 4.2 wa, 0.0 hi, 0.0 si, 0.0 st
MiB Mem : 96660.7 total, 53299.8 free, 34248.4 used, 9112.6 buff/cache
MiB Swap: 8192.0 total, 7577.0 free, 615.0 used. 61490.0 avail Mem
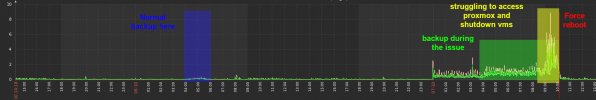
The IOs are terrible slow that I hardly access to the webUi or access to system journal. It is not a network issue.
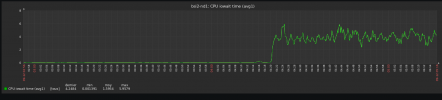
Based on a zabbix graph (CPU IOwait time avg1), we can see IOwait goes from 0.1 to 4.0. It is a lot more but does not seems very high.
It seems to begin at 00:00.
3 scripts are executed at 00:00 but should not be "dangerous".
If someone can confirm or not this is a hardware issue, I will glad to hear.
We notice on a DELL r710 IOs issues. This seems to happens once every 6 month randomly (then 2-3 month and now once a month) and require a hard reboot of the server.
VMs are slow, proxmox is slow/unresponsive.
The server is a DELL r710 on a raid 10 (PERC 6/i Integrated).
The read and write are below 1MiB/s.
Here is a example where everything is good :
INFO: 0% (514.7 MiB of 300.0 GiB) in 3s, read: 171.6 MiB/s, write: 29.6 MiB/s
INFO: 1% (3.0 GiB of 300.0 GiB) in 1m 35s, read: 27.9 MiB/s, write: 27.5 MiB/s
INFO: 2% (6.0 GiB of 300.0 GiB) in 3m 24s, read: 28.3 MiB/s, write: 27.7 MiB/s
INFO: 3% (9.0 GiB of 300.0 GiB) in 5m 21s, read: 26.2 MiB/s, write: 25.9 MiB/s
INFO: 4% (12.0 GiB of 300.0 GiB) in 7m 18s, read: 26.3 MiB/s, write: 26.1 MiB/s
INFO: 5% (15.0 GiB of 300.0 GiB) in 8m 59s, read: 30.8 MiB/s, write: 30.4 MiB/s
INFO: 6% (18.1 GiB of 300.0 GiB) in 9m 49s, read: 61.5 MiB/s, write: 61.3 MiB/s
And when there is IOs issue :
INFO: 0% (2.6 MiB of 300.0 GiB) in 3s, read: 896.0 KiB/s, write: 133.3 KiB/s
INFO: 1% (3.0 GiB of 300.0 GiB) in 1h 15m 40s, read: 692.9 KiB/s, write: 589.4 KiB/s
INFO: 2% (6.0 GiB of 300.0 GiB) in 2h 29m 30s, read: 710.1 KiB/s, write: 695.7 KiB/s
INFO: 3% (9.0 GiB of 300.0 GiB) in 3h 50m 57s, read: 643.7 KiB/s, write: 634.5 KiB/s
INFO: 4% (12.0 GiB of 300.0 GiB) in 5h 8m 10s, read: 678.9 KiB/s, write: 674.4 KiB/s
Here is a top when there is the issue :
top - 09:49:52 up 16 days, 23:47, 1 user, load average: 2.23, 2.53, 2.32
Tasks: 370 total, 1 running, 369 sleeping, 0 stopped, 0 zombie
%Cpu(s): 4.9 us, 0.7 sy, 0.0 ni, 90.1 id, 4.2 wa, 0.0 hi, 0.0 si, 0.0 st
MiB Mem : 96660.7 total, 53299.8 free, 34248.4 used, 9112.6 buff/cache
MiB Swap: 8192.0 total, 7577.0 free, 615.0 used. 61490.0 avail Mem
The IOs are terrible slow that I hardly access to the webUi or access to system journal. It is not a network issue.
Based on a zabbix graph (CPU IOwait time avg1), we can see IOwait goes from 0.1 to 4.0. It is a lot more but does not seems very high.
It seems to begin at 00:00.
3 scripts are executed at 00:00 but should not be "dangerous".
Code:
#!/bin/sh
raid=$(/usr/sbin/megaclisas-status)
datapercent=$(/usr/sbin/lvs pve/data -o data_percent --noheading | /usr/bin/sed -e 's/^[[:space:]]*//')

/usr/bin/zabbix_sender -c /etc/zabbix/zabbix_agentd.conf -k system.raid.disk.status -o "$raid"
/usr/bin/zabbix_sender -c /etc/zabbix/zabbix_agentd.conf -k system.lvm.data.percent -o "$datapercent"
Code:
#!/bin/sh
smart1=$(/usr/sbin/megacli -PDList -aAll | grep "Drive has flagged a S.M.A.R.T alert" | sed '1q;d')
smart2=$(/usr/sbin/megacli -PDList -aAll | grep "Drive has flagged a S.M.A.R.T alert" | sed '2q;d')
smart3=$(/usr/sbin/megacli -PDList -aAll | grep "Drive has flagged a S.M.A.R.T alert" | sed '3q;d')
smart4=$(/usr/sbin/megacli -PDList -aAll | grep "Drive has flagged a S.M.A.R.T alert" | sed '4q;d')

/usr/bin/zabbix_sender -c /etc/zabbix/zabbix_agentd.conf -k system.disk.smartmegacli[1] -o "$smart1"
/usr/bin/zabbix_sender -c /etc/zabbix/zabbix_agentd.conf -k system.disk.smartmegacli[2] -o "$smart2"
/usr/bin/zabbix_sender -c /etc/zabbix/zabbix_agentd.conf -k system.disk.smartmegacli[3] -o "$smart3"
/usr/bin/zabbix_sender -c /etc/zabbix/zabbix_agentd.conf -k system.disk.smartmegacli[4] -o "$smart4"
Code:
#!/bin/sh
temp1=$(/usr/sbin/megacli -PDList -aAll | grep Temperature | sed '1q;d' | grep -o -P "\d+C" | grep -o -P "\d+")
temp2=$(/usr/sbin/megacli -PDList -aAll | grep Temperature | sed '2q;d' | grep -o -P "\d+C" | grep -o -P "\d+")
temp3=$(/usr/sbin/megacli -PDList -aAll | grep Temperature | sed '3q;d' | grep -o -P "\d+C" | grep -o -P "\d+")
temp4=$(/usr/sbin/megacli -PDList -aAll | grep Temperature | sed '4q;d' | grep -o -P "\d+C" | grep -o -P "\d+")


/usr/bin/zabbix_sender -c /etc/zabbix/zabbix_agentd.conf -k system.disk.temperature[1] -o "$temp1"
/usr/bin/zabbix_sender -c /etc/zabbix/zabbix_agentd.conf -k system.disk.temperature[2] -o "$temp2"
/usr/bin/zabbix_sender -c /etc/zabbix/zabbix_agentd.conf -k system.disk.temperature[3] -o "$temp3"
/usr/bin/zabbix_sender -c /etc/zabbix/zabbix_agentd.conf -k system.disk.temperature[4] -o "$temp4"
If someone can confirm or not this is a hardware issue, I will glad to hear.