[SOLVED] Ceph (stretched cluster) performance troubleshooting

Mar 27, 2021
102
15
23
43
Hi team, community,

Need some help/guidance/know-how on how to proceed with troubleshooting and resolving the ceph performance issues we are currently observing.

The setup
The cluster is stretched primarily across 2 datacenters.
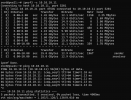
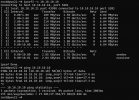
The network between the DCs is 10GB/s, the latency is 1.1ms RTT - see attached results from ping and iperf.
3 servers in each DC, 4 OSD's per server, 24 OSDs in total.
The OSD's are 2TB Samsung 970 EVO Plus NVMe - I know consumer grade...

We also have one server in 3rd DC that is member of the cluster and has ceph monitor - to ensure quorum in case one of the DCs fail.
The third DC is farther away, the link is about 2GB/s with 17.5 ms RTT latency - see second screenshot.
There are no workloads here, only corosync and ceph mon.
Not sure if this monitor can cause issues somehow....

The config
Ceph is configured with min of 2 and max of 4 replicas. This is to ensure that at least 2 replicas are available in one of the datacenters.
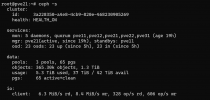
The crush map is attached. The ceph status is normal, please note the current load:
Code:
io:
    client:   6.3 MiB/s rd, 8.4 MiB/s wr, 328 op/s rd, 606 op/s wr

The problem
Most of our workloads work with many small files, we have being working on migrating VMs to the cluster which is now paused until we resolve this.
Initially the performance was OK, but after migrating 20-ish production servers the performance issues have became visible.
The simple test we did is moving the VM disk to the local-zfs volume (zfs mirror on 2x Micron MTFDDAF480TDS for PVE OS), after which the performance issues disappeared for that workload.
Moving back to ceph re-creates the problem asap.

The troubleshooting
We have run few test to try and troubleshoot the issue - our primary focus was around the network and the NVMe performance.
We have being doing multiple iperf test of the network - peak/quiet hours, and have monitored the network load via iftop. No obvious trouble in this space.
Next we went after the disk and started with rados bench which have not yield any obvious problems problems - see next attachment with the results.

writes
Code:
Total time run:         100.061
Total writes made:      15148
Write size:             4194304
Object size:            4194304
Bandwidth (MB/sec):     605.549
Stddev Bandwidth:       85.0185
Max bandwidth (MB/sec): 1196
Min bandwidth (MB/sec): 480
Average IOPS:           151
Stddev IOPS:            21.2546
Max IOPS:               299
Min IOPS:               120
Average Latency(s):     0.105664
Stddev Latency(s):      0.0538286
Max latency(s):         0.375314
Min latency(s):         0.0167309

reads
Code:
Total time run:         100.061
Total writes made:      15148
Write size:             4194304
Object size:            4194304
Bandwidth (MB/sec):     605.549
Stddev Bandwidth:       85.0185
Max bandwidth (MB/sec): 1196
Min bandwidth (MB/sec): 480
Average IOPS:           151
Stddev IOPS:            21.2546
Max IOPS:               299
Min IOPS:               120
Average Latency(s):     0.105664
Stddev Latency(s):      0.0538286
Max latency(s):         0.375314
Min latency(s):         0.0167309

Next we decided to test the disks with fio...

Samsung 970 EVO Plus 2TB NVMe
Code:
Jobs: 1 (f=1): [W(1)][100.0%][w=2230KiB/s][w=557 IOPS][eta 00m:00s]

Micron MTFDDAF480TDS 500GB SSD
Code:
Jobs: 1 (f=1): [W(1)][100.0%][w=68.0MiB/s][w=17.7k IOPS][eta 00m:00s]

This the fio command we ran
Code:
fio --ioengine=libaio --filename=/dev/sdb --direct=1 --sync=1 --rw=write --bs=4K --numjobs=1 --iodepth=1 --runtime=60 --time_based --name=fio

Obviously the Micron's have much better performance although being SSD's. Consumer vs. Enterprise is not a mith.

The conclusion
Looks like the whole team here is joining brains around running out of IOPS on the Samsung NVMEs... Note the output of the "ceph -s" command.
The remediation for this would be to swap with enterprise NVMEs or even SSDs since these have lot more IOPS and better performance.

The ASK
Are we going in the right direction here?
Is there any other test that we can perform to validate the issues?

We would like to repeat the test after remediation.
Please let me know if additional details are needed.

MANY THANKS!
 

Attachments

Last edited:
Hi,
Ceph and Consumer-Grade SSD/NVME is a NoGo. You can do this for Lab or Testing, but forget about this in production workload.
When consumer SSDs get "load" more than from a typical Desktop-OS they just drop down to near zero performance. Main-Problem here is the very limited cache. Often these disks can accept an amount of data very fast. Let's say 20GB for example. If this space is exhausted the disk has much overhead by organizing itself and goes to crawl mode..... You can compensate a bit by having many many of these disks but at the end... use Enterprise-Grade-Disks.

Also make sure that your CEPH-Storage-Cluster-Network and Client-Network which has not much to do with Proxmox-Client or Corosync-Network is fast and isolated. At least 10GBe better 40GBe or more....
 
Thanks for the reply!
I was expecting the answer with "use enterprise grade SSD/NVME".
And yes, the corosync, ceph and VM networks are segregated, 10GBe is available and is far from being saturated.

We have 40TB pool (24 drives) which is 11% utilized and the load we generate is very low from my perspective.
Hence I am struggling to explain why the disks fall short (or at lead which part of their performance - IOPS, throughput, cache or whatever).

1635926444931.png

What I am looking out of this is:
- prove why the disk are falling short by running "a test" (which is the best test is the question)
- re-run the test when we switch to enterprise grade drives and prove the bottleneck is gone (and monitor for that bottleneck in the future)

Appreciate any suggestions.

Thanks!
 
Please post your
Code:
cat /etc/ceph/ceph.conf
 
And consider your RTT 1.1ms RTT is not really helpful for performance....
From: ceph-performance-guide-2020-for-ssd-nvme

5 cents about networks:

What we have obverved is that in 90% of all setups, the bottleneck is the network itself. One can think of the network as the wire between the mainboard and the disk in a regular computer.

With ceph, latency matters. Even though the disk itself is rather fast, if one has a slow network (long latency) data can not be written/read from other ceph nodes.

Here are some numbers you should test/have in mind for your own setup:

# ping -c 100 IP of your ceph node

Ran above ping test from one node to another.

0.05-0.07ms latency is ok.
 
Appreciate you for taking the time, I really do!

Code:
root@pve11:~# cat /etc/ceph/ceph.conf
[global]
         auth_client_required = cephx
         auth_cluster_required = cephx
         auth_service_required = cephx
         cluster_network = 10.10.12.11/24
         fsid = 3a228350-a4e8-4cb9-820e-468230905269
         mon_allow_pool_delete = true
         mon_host = 10.10.12.11 10.10.12.12 10.10.12.21 10.10.12.22 10.10.12.10
         ms_bind_ipv4 = true
         osd_pool_default_min_size = 2
         osd_pool_default_size = 4
         public_network = 10.10.12.11/24

[client]
         keyring = /etc/pve/priv/$cluster.$name.keyring

[mon.pve11]
         public_addr = 10.10.12.11

[mon.pve12]
         public_addr = 10.10.12.12

[mon.pve21]
         public_addr = 10.10.12.21

[mon.pve22]
         public_addr = 10.10.12.22

[mon.pve31]
         public_addr = 10.10.12.10

DC1 - pve11 and pve12
DC2 - pve21 and pve22
DC3 - pve31 (only monitor, no OSDs)

Code:
100 packets transmitted, 100 received, 0% packet loss, time 99111ms
rtt min/avg/max/mdev = 1.038/1.126/1.336/0.044 ms

I am now thinking if it is a good idea to update the crush map and fall back to single DC setup.
Disable OSDs in second DC and test performance - e.g. fio from VM
 
Hi,
you can make a quick and dirty test and shut down DC2-Servers. You should have still 2 copies then.
Run Benchmark again. Even with half OSDs missing, the performance should be far better considering an average RTT of 1.126 for reaching any OSD on the other DC. But keep in mind, your are still using consumer SSDs.....

If performance is good then optimize connection between DC1 and DC2... FC-Cable? Or fallback to single Datacenter configuration. But you will loose some "redundancy".. but you know that.... ;-)
 
About your Ceph.conf.... it is nearly default... you can get between 10 to 30% more performance with several changes. But this should be more a step B after you have fixed the overall-performance-issue....
 
  • Like
Reactions: hepo
Here comes the results... both tests are ran from same VM the disk (sdb) resigns on ceph.
The fio command I've used (took it from the ceph benchmark test performed by the proxmox team - pinned on top of the forum)

Code:
fio --ioengine=libaio --filename=/dev/sdb --direct=1 --sync=1 --rw=write --bs=4K --numjobs=1 --iodepth=1 --runtime=60 --time_based --name=fio

Dual DC setup - 4 replicas of the images

Code:
admin@benchbox:~$ sudo fio --ioengine=libaio --filename=/dev/sdb --direct=1 --sync=1 --rw=write --bs=4K --numjobs=1 --iodepth=1 --runtime=60 --time_based --name=fio
fio: (g=0): rw=write, bs=(R) 4096B-4096B, (W) 4096B-4096B, (T) 4096B-4096B, ioengine=libaio, iodepth=1
fio-3.16
Starting 1 process
Jobs: 1 (f=1): [W(1)][100.0%][w=260KiB/s][w=65 IOPS][eta 00m:00s]
fio: (groupid=0, jobs=1): err= 0: pid=2107: Wed Nov  3 09:04:44 2021
  write: IOPS=61, BW=248KiB/s (254kB/s)(14.5MiB/60002msec); 0 zone resets
    slat (usec): min=8, max=116, avg=29.26, stdev=15.25
    clat (usec): min=9152, max=60419, avg=16112.77, stdev=3779.58
     lat (usec): min=9169, max=60537, avg=16142.79, stdev=3779.82
    clat percentiles (usec):
     |  1.00th=[10814],  5.00th=[11600], 10.00th=[12387], 20.00th=[13304],
     | 30.00th=[13960], 40.00th=[14615], 50.00th=[15270], 60.00th=[16188],
     | 70.00th=[17171], 80.00th=[18482], 90.00th=[20317], 95.00th=[22938],
     | 99.00th=[28705], 99.50th=[32113], 99.90th=[40109], 99.95th=[58459],
     | 99.99th=[60556]
   bw (  KiB/s): min=  192, max=  328, per=100.00%, avg=247.63, stdev=26.05, samples=120
   iops        : min=   48, max=   82, avg=61.88, stdev= 6.53, samples=120
  lat (msec)   : 10=0.19%, 20=88.54%, 50=11.22%, 100=0.05%
  cpu          : usr=0.08%, sys=0.16%, ctx=7431, majf=0, minf=12
  IO depths    : 1=100.0%, 2=0.0%, 4=0.0%, 8=0.0%, 16=0.0%, 32=0.0%, >=64=0.0%
     submit    : 0=0.0%, 4=100.0%, 8=0.0%, 16=0.0%, 32=0.0%, 64=0.0%, >=64=0.0%
     complete  : 0=0.0%, 4=100.0%, 8=0.0%, 16=0.0%, 32=0.0%, 64=0.0%, >=64=0.0%
     issued rwts: total=0,3716,0,0 short=0,0,0,0 dropped=0,0,0,0
     latency   : target=0, window=0, percentile=100.00%, depth=1

Run status group 0 (all jobs):
  WRITE: bw=248KiB/s (254kB/s), 248KiB/s-248KiB/s (254kB/s-254kB/s), io=14.5MiB (15.2MB), run=60002-60002msec

Disk stats (read/write):
  sdb: ios=51/3711, merge=0/0, ticks=21/59795, in_queue=52344, util=99.96%

Single DC setup - 2 replicas of the images

Code:
admin@benchbox:~$ sudo fio --ioengine=libaio --filename=/dev/sdb --direct=1 --sync=1 --rw=write --bs=4K --numjobs=1 --iodepth=1 --runtime=60 --time_based --name=fio
fio: (g=0): rw=write, bs=(R) 4096B-4096B, (W) 4096B-4096B, (T) 4096B-4096B, ioengine=libaio, iodepth=1
fio-3.16
Starting 1 process
Jobs: 1 (f=1): [W(1)][100.0%][w=736KiB/s][w=184 IOPS][eta 00m:00s]
fio: (groupid=0, jobs=1): err= 0: pid=2580: Wed Nov  3 09:32:22 2021
  write: IOPS=217, BW=870KiB/s (891kB/s)(50.0MiB/60003msec); 0 zone resets
    slat (usec): min=9, max=106, avg=31.55, stdev=16.25
    clat (usec): min=2932, max=22028, avg=4561.20, stdev=1325.72
     lat (usec): min=2953, max=22049, avg=4593.57, stdev=1326.43
    clat percentiles (usec):
     |  1.00th=[ 3294],  5.00th=[ 3490], 10.00th=[ 3621], 20.00th=[ 3785],
     | 30.00th=[ 3916], 40.00th=[ 4047], 50.00th=[ 4178], 60.00th=[ 4359],
     | 70.00th=[ 4555], 80.00th=[ 5014], 90.00th=[ 5932], 95.00th=[ 6915],
     | 99.00th=[10159], 99.50th=[11994], 99.90th=[16909], 99.95th=[17695],
     | 99.99th=[20579]
   bw (  KiB/s): min=  592, max= 1032, per=99.98%, avg=869.87, stdev=90.27, samples=120
   iops        : min=  148, max=  258, avg=217.43, stdev=22.58, samples=120
  lat (msec)   : 4=36.20%, 10=62.73%, 20=1.05%, 50=0.02%
  cpu          : usr=0.35%, sys=0.57%, ctx=26110, majf=0, minf=11
  IO depths    : 1=100.0%, 2=0.0%, 4=0.0%, 8=0.0%, 16=0.0%, 32=0.0%, >=64=0.0%
     submit    : 0=0.0%, 4=100.0%, 8=0.0%, 16=0.0%, 32=0.0%, 64=0.0%, >=64=0.0%
     complete  : 0=0.0%, 4=100.0%, 8=0.0%, 16=0.0%, 32=0.0%, 64=0.0%, >=64=0.0%
     issued rwts: total=0,13051,0,0 short=0,0,0,0 dropped=0,0,0,0
     latency   : target=0, window=0, percentile=100.00%, depth=1

Run status group 0 (all jobs):
  WRITE: bw=870KiB/s (891kB/s), 870KiB/s-870KiB/s (891kB/s-891kB/s), io=50.0MiB (53.5MB), run=60003-60003msec

Disk stats (read/write):
  sdb: ios=48/13029, merge=0/0, ticks=23/59495, in_queue=35020, util=99.96%

I am not great with reading the result of the command to be honest, but if I put the highlights together for easy comparisons 2DC vs. 1DC

Code:
Jobs: 1 (f=1): [W(1)][100.0%][w=260KiB/s][w=65 IOPS][eta 00m:00s]
Jobs: 1 (f=1): [W(1)][100.0%][w=736KiB/s][w=184 IOPS][eta 00m:00s]

Run status group 0 (all jobs): WRITE: bw=248KiB/s (254kB/s), 248KiB/s-248KiB/s (254kB/s-254kB/s), io=14.5MiB (15.2MB), run=60002-60002msec
Run status group 0 (all jobs): WRITE: bw=870KiB/s (891kB/s), 870KiB/s-870KiB/s (891kB/s-891kB/s), io=50.0MiB (53.5MB), run=60003-60003msec

Disk stats (read/write): sdb: ios=51/3711, merge=0/0, ticks=21/59795, in_queue=52344, util=99.96%
Disk stats (read/write): sdb: ios=48/13029, merge=0/0, ticks=23/59495, in_queue=35020, util=99.96%

I honestly don't see any huge difference.

Opinion?
 
Correct me if I am wrong, but you have nearly twice nearly triple IOPS with half OSDs?
 
Also to be compete, I need to share the network performance within the DC

Code:
100 packets transmitted, 100 received, 0% packet loss, time 99873ms
rtt min/avg/max/mdev = 0.039/0.118/0.216/0.040 ms

Code:
root@pve11:~# iperf3 -c 10.10.12.12
Connecting to host 10.10.12.12, port 5201
[  5] local 10.10.12.11 port 35188 connected to 10.10.12.12 port 5201
[ ID] Interval           Transfer     Bitrate         Retr  Cwnd
[  5]   0.00-1.00   sec  2.61 GBytes  22.4 Gbits/sec  554   1.35 MBytes
[  5]   1.00-2.00   sec  2.31 GBytes  19.9 Gbits/sec   71   1.16 MBytes
[  5]   2.00-3.00   sec  2.12 GBytes  18.2 Gbits/sec    0   1.16 MBytes
[  5]   3.00-4.00   sec  2.67 GBytes  22.9 Gbits/sec  345   1.82 MBytes
[  5]   4.00-5.00   sec  2.66 GBytes  22.9 Gbits/sec  349   1.34 MBytes
[  5]   5.00-6.00   sec  2.67 GBytes  22.9 Gbits/sec  509   1.15 MBytes
[  5]   6.00-7.00   sec  2.70 GBytes  23.2 Gbits/sec  459   1.19 MBytes
[  5]   7.00-8.00   sec  2.43 GBytes  20.9 Gbits/sec  309   1.27 MBytes
[  5]   8.00-9.00   sec  2.21 GBytes  19.0 Gbits/sec  124   1.19 MBytes
[  5]   9.00-10.00  sec  2.61 GBytes  22.4 Gbits/sec  342   1.47 MBytes
- - - - - - - - - - - - - - - - - - - - - - - - -
[ ID] Interval           Transfer     Bitrate         Retr
[  5]   0.00-10.00  sec  25.0 GBytes  21.5 Gbits/sec  3062             sender
[  5]   0.00-10.00  sec  25.0 GBytes  21.4 Gbits/sec                  receiver

Almost ideal (by the book)
 
Again, I am not confident in reading/interpreting this data well, but I think the "improvement" is a joke.

Let me add another element to the comparison. This is same VM, the disk this time is on local-zfs disk (the boot disk, zfs mirror, Micron SSD)

Dual DC ceph
Single DC ceph
Local-zfs disk

Code:
Jobs: 1 (f=1): [W(1)][100.0%][w=260KiB/s][w=65 IOPS][eta 00m:00s]
Jobs: 1 (f=1): [W(1)][100.0%][w=736KiB/s][w=184 IOPS][eta 00m:00s]
Jobs: 1 (f=1): [W(1)][100.0%][w=9712KiB/s][w=2428 IOPS][eta 00m:00s]

Run status group 0 (all jobs): WRITE: bw=248KiB/s (254kB/s), 248KiB/s-248KiB/s (254kB/s-254kB/s), io=14.5MiB (15.2MB), run=60002-60002msec
Run status group 0 (all jobs): WRITE: bw=870KiB/s (891kB/s), 870KiB/s-870KiB/s (891kB/s-891kB/s), io=50.0MiB (53.5MB), run=60003-60003msec
Run status group 0 (all jobs): WRITE: bw=9.77MiB/s (10.2MB/s), 9.77MiB/s-9.77MiB/s (10.2MB/s-10.2MB/s), io=586MiB (614MB), run=60001-60001msec

Disk stats (read/write): sdb: ios=51/3711, merge=0/0, ticks=21/59795, in_queue=52344, util=99.96%
Disk stats (read/write): sdb: ios=48/13029, merge=0/0, ticks=23/59495, in_queue=35020, util=99.96%
Disk stats (read/write): sdb: ios=51/149767, merge=0/0, ticks=7/58393, in_queue=228, util=99.94%

This is now improvement in my eyes ;)
 
I understand what you expect. I also agree that performance overall is not good in your CEPH-Deployment.

Short answer: dont use consumer disks. The firmware and tech is not built for enterprise like Ceph.
Longer version: We can spend hours and days to get more performance on your current setup. Maybe we can reach reasonable performance after tuning and changing dozens of parameters. In the end it will be some "hiding" of the consumer-ssd-weakness by setting Caches over Caches in parameter... but believe me, you don't want that. Even with light workload in writing these Samsung Consumer SSDs will die very very fast.....

When you want an Enterprise-Grade High Availability Cluster... then use Enterprise-Grade hardware....without exception....
So consider contacting a consultant for Proxmox-HA-HCI-Cluster and ask him about right Hardware.
You may also contact paid support, but I bet first recommendation will be... get rid of that ConsumerSSD....
 
  • Like
Reactions: hepo
@itNGO would it be too much if I ask you to run the same command on your cluster so we can compare?
Sure, but that is like comparing apples with pears... however

Code:
Jobs: 1 (f=1): [W(1)][100.0%][w=28.0MiB/s][w=7179 IOPS][eta 00m:00s]
Run status group 0 (all jobs): WRITE: bw=25.2MiB/s (26.5MB/s), 25.2MiB/s-25.2MiB/s (26.5MB/s-26.5MB/s), io=1514MiB (1588MB), run=60001-60001msec
Disk stats (read/write): sdb: ios=48/386874, merge=0/0, ticks=13/53332, in_queue=2436, util=99.87%

This is with 8 WD NVME in 4-Way-Mirror-Ceph on 2 Nodes in same Datacenter connected with 2x100GBe on AMD Epyc 7343

The Cluster is under production load... HEAVY Production Load....
 
You are the best! It is clear that we are not comparable.
Gives me a perspective.

We have started the process of exchanging the consumer sh1t, and hope to have a plan very very soon.

Appreciate you @itNGO !!!
 
  • Like
Reactions: itNGO
Took these numbers a while ago but couldn't post them until now... Hope they help you and give some more baseline performance.

VM running on 3 node Proxmox 6.4 in same DC, Ceph Nautilus. 2 vCPU of an Intel(R) Xeon(R) Gold 5218 CPU @ 2.30GHz, 4Gb ram. Linux mint 20.1. /dev/sdb has 20GB on a ceph storage set up as 3/2 replicas. Proxmox hosts have 1 single 4TB NVMe disk, INTEL DC P4510, partitioned as 4 OSDs. Ceph network is 2x10GbE. No tunning has been done at any level. Cluster was under like 20% load at the time of testing:

Code:
fio --ioengine=libaio --filename=/dev/sdb --direct=1 --sync=1 --rw=write --bs=4K --numjobs=1 --iodepth=1 --runtime=60 --time_based --name=fio

Jobs: 1 (f=1): [W(1)][100.0%][w=5544KiB/s][w=1386 IOPS][eta 00m:00s]
fio: (groupid=0, jobs=1): err= 0: pid=4910: Wed Nov  3 14:15:53 2021
  write: IOPS=1710, BW=6844KiB/s (7008kB/s)(401MiB/60001msec); 0 zone resets
    slat (usec): min=3, max=268, avg=11.89, stdev= 6.68
    clat (usec): min=358, max=17731, avg=571.22, stdev=192.80
     lat (usec): min=365, max=17743, avg=583.33, stdev=193.36
    clat percentiles (usec):
     |  1.00th=[  400],  5.00th=[  424], 10.00th=[  441], 20.00th=[  465],
     | 30.00th=[  486], 40.00th=[  510], 50.00th=[  537], 60.00th=[  570],
     | 70.00th=[  603], 80.00th=[  644], 90.00th=[  717], 95.00th=[  791],
     | 99.00th=[ 1205], 99.50th=[ 1516], 99.90th=[ 2040], 99.95th=[ 3523],
     | 99.99th=[ 6456]
   bw (  KiB/s): min= 5304, max= 8048, per=100.00%, avg=6854.26, stdev=656.13, samples=119
   iops        : min= 1326, max= 2012, avg=1713.55, stdev=164.04, samples=119
  lat (usec)   : 500=35.68%, 750=56.72%, 1000=6.14%
  lat (msec)   : 2=1.35%, 4=0.07%, 10=0.04%, 20=0.01%
  cpu          : usr=0.52%, sys=1.68%, ctx=205332, majf=0, minf=13
  IO depths    : 1=100.0%, 2=0.0%, 4=0.0%, 8=0.0%, 16=0.0%, 32=0.0%, >=64=0.0%
     submit    : 0=0.0%, 4=100.0%, 8=0.0%, 16=0.0%, 32=0.0%, 64=0.0%, >=64=0.0%
     complete  : 0=0.0%, 4=100.0%, 8=0.0%, 16=0.0%, 32=0.0%, 64=0.0%, >=64=0.0%
     issued rwts: total=0,102657,0,0 short=0,0,0,0 dropped=0,0,0,0
     latency   : target=0, window=0, percentile=100.00%, depth=1

Run status group 0 (all jobs):
  WRITE: bw=6844KiB/s (7008kB/s), 6844KiB/s-6844KiB/s (7008kB/s-7008kB/s), io=401MiB (420MB), run=60001-60001msec

Disk stats (read/write):
  sdb: ios=48/102509, merge=0/0, ticks=6/58927, in_queue=176, util=99.93%

It really gets my attention the much higher latencies that your disks show. Looks as if the disk got busy doing something to be able to write the data and return an ACK to Ceph, increasing latency. Just use the right tool for the job and ditch those Samsung 970 EVO.
 
Last edited:
  • Like
Reactions: hepo

About

The Proxmox community has been around for many years and offers help and support for Proxmox VE, Proxmox Backup Server, and Proxmox Mail Gateway.
We think our community is one of the best thanks to people like you!

Get your subscription!

The Proxmox team works very hard to make sure you are running the best software and getting stable updates and security enhancements, as well as quick enterprise support. Tens of thousands of happy customers have a Proxmox subscription. Get yours easily in our online shop.

Buy now!