[SOLVED] CEPH performance ok?

PmUserZFS

Well-Known Member
Feb 2, 2018
77
2
48
Running a a labb ( so no real prod usecase, except nice to have) 3 node ceph cluster a 6 hgst sas ssd 200GB, standard setup with 3 replikas.

on a 2x10Gbps network, shared network with vms, but there are no vms here yet, so very little other traffic.

Ran this fio benchmark in a ubuntu vm, is peformance ok ?

Code:
test:~$ fio --name=randrw --rw=randrw --direct=1 --ioengine=libaio --bs=16k --numjobs=4 --rwmixread=75 --size=1G --runtime=300 --group_reporting
randrw: (g=0): rw=randrw, bs=(R) 16.0KiB-16.0KiB, (W) 16.0KiB-16.0KiB, (T) 16.0KiB-16.0KiB, ioengine=libaio, iodepth=1
...
fio-3.28
Starting 4 processes
randrw: Laying out IO file (1 file / 1024MiB)
Jobs: 2 (f=2): [m(1),_(2),m(1)][100.0%][r=18.1MiB/s,w=5829KiB/s][r=1158,w=364 IOPS][eta 00m:00s]
randrw: (groupid=0, jobs=4): err= 0: pid=1432: Wed Jan 10 15:25:05 2024
  read: IOPS=1377, BW=21.5MiB/s (22.6MB/s)(3068MiB/142491msec)
    slat (usec): min=13, max=3966, avg=55.57, stdev=33.85
    clat (usec): min=3, max=11290, avg=1399.55, stdev=208.86
     lat (usec): min=827, max=11340, avg=1456.01, stdev=209.81
    clat percentiles (usec):
     |  1.00th=[ 1057],  5.00th=[ 1156], 10.00th=[ 1205], 20.00th=[ 1270],
     | 30.00th=[ 1303], 40.00th=[ 1352], 50.00th=[ 1385], 60.00th=[ 1418],
     | 70.00th=[ 1467], 80.00th=[ 1516], 90.00th=[ 1582], 95.00th=[ 1663],
     | 99.00th=[ 1942], 99.50th=[ 2147], 99.90th=[ 3687], 99.95th=[ 3949],
     | 99.99th=[ 6128]
   bw (  KiB/s): min=16864, max=26738, per=100.00%, avg=22164.23, stdev=430.28, samples=1132
   iops        : min= 1054, max= 1671, avg=1385.16, stdev=26.90, samples=1132
  write: IOPS=461, BW=7389KiB/s (7566kB/s)(1028MiB/142491msec); 0 zone resets
    slat (usec): min=22, max=3623, avg=65.55, stdev=48.14
    clat (usec): min=2586, max=17296, avg=4180.24, stdev=1235.19
     lat (usec): min=2660, max=17349, avg=4246.77, stdev=1235.72
    clat percentiles (usec):
     |  1.00th=[ 2900],  5.00th=[ 3032], 10.00th=[ 3097], 20.00th=[ 3228],
     | 30.00th=[ 3326], 40.00th=[ 3458], 50.00th=[ 3654], 60.00th=[ 4047],
     | 70.00th=[ 4555], 80.00th=[ 5080], 90.00th=[ 6128], 95.00th=[ 6718],
     | 99.00th=[ 8029], 99.50th=[ 8586], 99.90th=[10290], 99.95th=[10945],
     | 99.99th=[14484]
   bw (  KiB/s): min= 5980, max= 9152, per=100.00%, avg=7428.18, stdev=146.31, samples=1132
   iops        : min=  373, max=  572, avg=463.99, stdev= 9.15, samples=1132
  lat (usec)   : 4=0.01%, 10=0.01%, 500=0.01%, 1000=0.24%
  lat (msec)   : 2=74.07%, 4=15.39%, 10=10.26%, 20=0.03%
  cpu          : usr=1.16%, sys=3.74%, ctx=266786, majf=0, minf=60
  IO depths    : 1=100.0%, 2=0.0%, 4=0.0%, 8=0.0%, 16=0.0%, 32=0.0%, >=64=0.0%
     submit    : 0=0.0%, 4=100.0%, 8=0.0%, 16=0.0%, 32=0.0%, 64=0.0%, >=64=0.0%
     complete  : 0=0.0%, 4=100.0%, 8=0.0%, 16=0.0%, 32=0.0%, 64=0.0%, >=64=0.0%
     issued rwts: total=196339,65805,0,0 short=0,0,0,0 dropped=0,0,0,0
     latency   : target=0, window=0, percentile=100.00%, depth=1

Run status group 0 (all jobs):
   READ: bw=21.5MiB/s (22.6MB/s), 21.5MiB/s-21.5MiB/s (22.6MB/s-22.6MB/s), io=3068MiB (3217MB), run=142491-142491msec
  WRITE: bw=7389KiB/s (7566kB/s), 7389KiB/s-7389KiB/s (7566kB/s-7566kB/s), io=1028MiB (1078MB), run=142491-142491msec

Disk stats (read/write):
    dm-0: ios=196699/66085, merge=0/0, ticks=266148/272584, in_queue=538732, util=100.00%, aggrios=196699/66028, aggrmerge=0/57, aggrticks=270535/273071, aggrin_queue=543606, aggrutil=100.00%
  sda: ios=196699/66028, merge=0/57, ticks=270535/273071, in_queue=543606, util=100.00%
 
Network benchmark:

Bash:
@pm2:~# iperf -c 172.16.50.10 -i 2 -e
------------------------------------------------------------
Client connecting to 172.16.50.10, TCP port 5001 with pid 89725 (1 flows)
Write buffer size: 131072 Byte
TOS set to 0x0 (Nagle on)
TCP window size: 16.0 KByte (default)
------------------------------------------------------------
[  1] local 172.16.50.20%ceph port 48288 connected with 172.16.50.10 port 5001 (sock=3) (icwnd/mss/irtt=89/9164/419) (ct=0.52 ms) on 2024-01-10 16:59:35 (CET)
[ ID] Interval            Transfer    Bandwidth       Write/Err  Rtry     Cwnd/RTT(var)        NetPwr
[  1] 0.0000-2.0000 sec  2.31 GBytes  9.90 Gbits/sec  18890/0         15     2273K/1149(20) us  1077437
[  1] 2.0000-4.0000 sec  2.30 GBytes  9.90 Gbits/sec  18877/0          3     2273K/1185(36) us  1043986
[  1] 4.0000-6.0000 sec  2.30 GBytes  9.90 Gbits/sec  18880/0          0     2273K/1119(19) us  1105737
[  1] 6.0000-8.0000 sec  2.30 GBytes  9.90 Gbits/sec  18877/0          0     2273K/1157(50) us  1069251
[  1] 8.0000-10.0000 sec  2.30 GBytes  9.90 Gbits/sec  18878/0          1     2273K/1157(34) us  1069307
[  1] 0.0000-10.0163 sec  11.5 GBytes  9.88 Gbits/sec  94403/0         19     2273K/1139(19) us  1084583
 
What do you want to measure? To run into bandwidth limits, usually block sizes of 1M or 4M are used. To run into IOPS limits, a block size of 4k is usually used.

If you have a workload that is using 16k (database?), then sure run it with that, but then you should probably also use the --sync=1 option as that is what DBs typically use to make sure the write operation is only ACKed once it is actually written down. This will usually drop the results quite a bit.
mostly differnt dbs in different vms, more io work, its a labb for servers/networking etc. but decent performance is preferred. Ill try and get more local storage for when performance is really needed.


with the current setup with 6 sas ssds one each node, that can push (peak iops) 50k/25k iops each, Id expect more performance 25MBps and 400ish iops is kinda low. Its in a vm too so more overhead, but still.
 
Last edited:
Use cache = writeback and simply give the VM as many cores as the node has and try again.

@Falk R. had already noted in another thread that the vCPU may be running into the limit. You could therefore assign more cores to the VM. Ideally as many as one CPU has in your server.
See: https://forum.proxmox.com/threads/i...ist-extrem-schlecht.134760/page-2#post-623240

Otherwise the general question is, which switches do you use? Do you have LACP enabled? If so, which hashing? Do you have jumbo frames enabled on the switch and nodes? How many PGs does your pool have?
 
Nexus 5548 lacp
Use cache = writeback and simply give the VM as many cores as the node has and try again.

@Falk R. had already noted in another thread that the vCPU may be running into the limit. You could therefore assign more cores to the VM. Ideally as many as one CPU has in your server.
See: https://forum.proxmox.com/threads/i...ist-extrem-schlecht.134760/page-2#post-623240

Otherwise the general question is, which switches do you use? Do you have LACP enabled? If so, which hashing? Do you have jumbo frames enabled on the switch and nodes? How many PGs does your pool have?
Ill try writeback! and i upped the cores to 8, altought cpu util was 50-75% during testing.

nexus 5548UP, see above iperf benchmark, performance is 10Gbit, LACP/vPC
 
test with 8 vcpu
Bash:
@test:~$ fio --name=randrw --rw=randrw --direct=1 --ioengine=libaio --bs=16k --numjobs=8 --rwmixread=75 --size=512MB --runtime=100 --sync=1 --group_reporting
randrw: (g=0): rw=randrw, bs=(R) 16.0KiB-16.0KiB, (W) 16.0KiB-16.0KiB, (T) 16.0KiB-16.0KiB, ioengine=libaio, iodepth=1
...
fio-3.28
Starting 8 processes
randrw: Laying out IO file (1 file / 512MiB)
fio: ENOSPC on laying out file, stopping
fio: pid=0, err=28/file:filesetup.c:240, func=write, error=No space left on device
Jobs: 7 (f=7): [m(7),X(1)][100.0%][r=18.5MiB/s,w=6448KiB/s][r=1182,w=403 IOPS][eta 00m:00s]
randrw: (groupid=0, jobs=8): err=28 (file:filesetup.c:240, func=write, error=No space left on device): pid=1089: Wed Jan 10 20:56:28 2024
  read: IOPS=1230, BW=19.2MiB/s (20.2MB/s)(1923MiB/100011msec)
    slat (usec): min=20, max=4278, avg=115.44, stdev=124.28
    clat (usec): min=6, max=27818, avg=1384.06, stdev=288.66
     lat (usec): min=874, max=27866, avg=1500.71, stdev=277.02
    clat percentiles (usec):
     |  1.00th=[  963],  5.00th=[ 1074], 10.00th=[ 1139], 20.00th=[ 1221],
     | 30.00th=[ 1270], 40.00th=[ 1319], 50.00th=[ 1369], 60.00th=[ 1418],
     | 70.00th=[ 1467], 80.00th=[ 1516], 90.00th=[ 1598], 95.00th=[ 1680],
     | 99.00th=[ 2089], 99.50th=[ 2900], 99.90th=[ 3884], 99.95th=[ 4146],
     | 99.99th=[ 8356]
   bw (  KiB/s): min= 7338, max=29184, per=100.00%, avg=19715.14, stdev=483.81, samples=1393
   iops        : min=  458, max= 1822, avg=1230.63, stdev=30.21, samples=1393
  write: IOPS=414, BW=6638KiB/s (6797kB/s)(648MiB/100011msec); 0 zone resets
    slat (usec): min=36, max=4324, avg=137.93, stdev=136.19
    clat (msec): min=5, max=146, avg=12.25, stdev= 3.67
     lat (msec): min=5, max=151, avg=12.38, stdev= 3.72
    clat percentiles (msec):
     |  1.00th=[    7],  5.00th=[    8], 10.00th=[    9], 20.00th=[   10],
     | 30.00th=[   11], 40.00th=[   12], 50.00th=[   13], 60.00th=[   14],
     | 70.00th=[   14], 80.00th=[   15], 90.00th=[   16], 95.00th=[   17],
     | 99.00th=[   20], 99.50th=[   24], 99.90th=[   38], 99.95th=[   63],
     | 99.99th=[  144]
   bw (  KiB/s): min= 2400, max= 7692, per=100.00%, avg=6644.31, stdev=69.94, samples=1393
   iops        : min=  150, max=  480, avg=414.91, stdev= 4.37, samples=1393
  lat (usec)   : 10=0.01%, 100=0.01%, 250=0.01%, 750=0.01%, 1000=1.35%
  lat (msec)   : 2=72.47%, 4=0.90%, 10=5.23%, 20=19.84%, 50=0.18%
  lat (msec)   : 100=0.01%, 250=0.01%
  cpu          : usr=0.65%, sys=2.12%, ctx=205020, majf=0, minf=115
  IO depths    : 1=100.0%, 2=0.0%, 4=0.0%, 8=0.0%, 16=0.0%, 32=0.0%, >=64=0.0%
     submit    : 0=0.0%, 4=100.0%, 8=0.0%, 16=0.0%, 32=0.0%, 64=0.0%, >=64=0.0%
     complete  : 0=0.0%, 4=100.0%, 8=0.0%, 16=0.0%, 32=0.0%, 64=0.0%, >=64=0.0%
     issued rwts: total=123053,41491,0,0 short=0,0,0,0 dropped=0,0,0,0

Run status group 0 (all jobs):
   READ: bw=19.2MiB/s (20.2MB/s), 19.2MiB/s-19.2MiB/s (20.2MB/s-20.2MB/s), io=1923MiB (2016MB), run=100011-100011msec
  WRITE: bw=6638KiB/s (6797kB/s), 6638KiB/s-6638KiB/s (6797kB/s-6797kB/s), io=648MiB (680MB), run=100011-100011msec

Disk stats (read/write):
    dm-0: ios=122955/96080, merge=0/0, ticks=174728/112696, in_queue=287424, util=100.00%, aggrios=123097/82763, aggrmerge=0/13597, aggrticks=176621/111251, aggrin_queue=377014, aggrutil=99.95%
  sda: ios=123097/82763, merge=0/13597, ticks=176621/111251, in_queue=377014, util=99.95%

I was using write back!


1704920181832.png

Ill change ssd=1 to none.
 
changing vcpu doesnt matter much at these low speeds it seems.

using sync=0 ( well no sync) yields 800ish write iops

Bash:
@test:~$ fio --name=randrw --rw=randrw --direct=1 --ioengine=libaio --bs=16k --numjobs=4 --rwmixread=75 --size=512MB --runtime=100  --group_reporting
randrw: (g=0): rw=randrw, bs=(R) 16.0KiB-16.0KiB, (W) 16.0KiB-16.0KiB, (T) 16.0KiB-16.0KiB, ioengine=libaio, iodepth=1
...
fio-3.28
Starting 4 processes
randrw: Laying out IO file (1 file / 512MiB)
Jobs: 4 (f=4): [m(4)][100.0%][r=40.0MiB/s,w=12.4MiB/s][r=2560,w=794 IOPS][eta 00m:00s]
randrw: (groupid=0, jobs=4): err= 0: pid=1167: Wed Jan 10 21:00:48 2024
  read: IOPS=2598, BW=40.6MiB/s (42.6MB/s)(1532MiB/37738msec)
    slat (usec): min=27, max=30077, avg=54.49, stdev=97.69
    clat (usec): min=5, max=32649, avg=1359.04, stdev=395.08
     lat (usec): min=886, max=32702, avg=1414.47, stdev=407.12
    clat percentiles (usec):
     |  1.00th=[ 1004],  5.00th=[ 1090], 10.00th=[ 1139], 20.00th=[ 1188],
     | 30.00th=[ 1237], 40.00th=[ 1270], 50.00th=[ 1319], 60.00th=[ 1352],
     | 70.00th=[ 1401], 80.00th=[ 1450], 90.00th=[ 1549], 95.00th=[ 1680],
     | 99.00th=[ 3064], 99.50th=[ 3523], 99.90th=[ 4293], 99.95th=[ 6063],
     | 99.99th=[14353]
   bw (  KiB/s): min=36320, max=43722, per=100.00%, avg=41956.05, stdev=276.45, samples=298
   iops        : min= 2270, max= 2732, avg=2621.58, stdev=17.29, samples=298
  write: IOPS=874, BW=13.7MiB/s (14.3MB/s)(516MiB/37738msec); 0 zone resets
    slat (usec): min=28, max=2947, avg=58.48, stdev=24.45
    clat (usec): min=104, max=18382, avg=245.45, stdev=119.08
     lat (usec): min=155, max=18445, avg=304.87, stdev=123.63
    clat percentiles (usec):
     |  1.00th=[  163],  5.00th=[  178], 10.00th=[  188], 20.00th=[  202],
     | 30.00th=[  215], 40.00th=[  225], 50.00th=[  237], 60.00th=[  249],
     | 70.00th=[  265], 80.00th=[  281], 90.00th=[  306], 95.00th=[  334],
     | 99.00th=[  424], 99.50th=[  449], 99.90th=[  775], 99.95th=[  865],
     | 99.99th=[ 1450]
   bw (  KiB/s): min=10836, max=18016, per=100.00%, avg=14138.90, stdev=370.10, samples=298
   iops        : min=  676, max= 1126, avg=883.14, stdev=23.15, samples=298
  lat (usec)   : 10=0.01%, 250=15.18%, 500=9.94%, 750=0.04%, 1000=0.71%
  lat (msec)   : 2=72.52%, 4=1.50%, 10=0.10%, 20=0.01%, 50=0.01%
  cpu          : usr=2.42%, sys=6.80%, ctx=131093, majf=0, minf=64
  IO depths    : 1=100.0%, 2=0.0%, 4=0.0%, 8=0.0%, 16=0.0%, 32=0.0%, >=64=0.0%
     submit    : 0=0.0%, 4=100.0%, 8=0.0%, 16=0.0%, 32=0.0%, 64=0.0%, >=64=0.0%
     complete  : 0=0.0%, 4=100.0%, 8=0.0%, 16=0.0%, 32=0.0%, 64=0.0%, >=64=0.0%
     issued rwts: total=98052,33020,0,0 short=0,0,0,0 dropped=0,0,0,0
     latency   : target=0, window=0, percentile=100.00%, depth=1

Run status group 0 (all jobs):
   READ: bw=40.6MiB/s (42.6MB/s), 40.6MiB/s-40.6MiB/s (42.6MB/s-42.6MB/s), io=1532MiB (1606MB), run=37738-37738msec
  WRITE: bw=13.7MiB/s (14.3MB/s), 13.7MiB/s-13.7MiB/s (14.3MB/s-14.3MB/s), io=516MiB (541MB), run=37738-37738msec

Disk stats (read/write):
    dm-0: ios=98012/33058, merge=0/0, ticks=130352/7628, in_queue=137980, util=99.92%, aggrios=98052/33052, aggrmerge=0/16, aggrticks=132444/7870, aggrin_queue=140371, aggrutil=99.80%
  sda: ios=98052/33052, merge=0/16, ticks=132444/7870, in_queue=140371, util=99.80%
 
Last edited:
Just to compare I setup a lxc with 16vcpu

Bash:
Jobs: 3 (f=3): [_(1),m(2),_(3),m(1),_(1)][100.0%][r=73.2MiB/s,w=7872KiB/s][r=4683,w=492 IOPS][eta 00m:00s]
randrw: (groupid=0, jobs=8): err= 0: pid=718: Wed Jan 10 21:17:07 2024
  read: IOPS=5626, BW=87.9MiB/s (92.2MB/s)(14.4GiB/167758msec)
    slat (usec): min=11, max=3186, avg=35.26, stdev=18.06
    clat (usec): min=4, max=37330, avg=1025.68, stdev=319.02
     lat (usec): min=592, max=37426, avg=1061.65, stdev=319.30
    clat percentiles (usec):
     |  1.00th=[  750],  5.00th=[  816], 10.00th=[  848], 20.00th=[  898],
     | 30.00th=[  930], 40.00th=[  963], 50.00th=[  988], 60.00th=[ 1020],
     | 70.00th=[ 1057], 80.00th=[ 1090], 90.00th=[ 1172], 95.00th=[ 1319],
     | 99.00th=[ 1811], 99.50th=[ 2606], 99.90th=[ 3589], 99.95th=[ 5342],
     | 99.99th=[12256]
   bw (  KiB/s): min=78048, max=102885, per=100.00%, avg=90650.95, stdev=514.66, samples=2659
   iops        : min= 4878, max= 6430, avg=5665.06, stdev=32.16, samples=2659
  write: IOPS=623, BW=9980KiB/s (10.2MB/s)(1635MiB/167758msec); 0 zone resets
    slat (usec): min=17, max=3728, avg=44.18, stdev=41.66
    clat (usec): min=2172, max=50129, avg=3052.21, stdev=859.43
     lat (usec): min=2214, max=50179, avg=3097.16, stdev=860.54
    clat percentiles (usec):
     |  1.00th=[ 2540],  5.00th=[ 2638], 10.00th=[ 2704], 20.00th=[ 2769],
     | 30.00th=[ 2802], 40.00th=[ 2868], 50.00th=[ 2900], 60.00th=[ 2966],
     | 70.00th=[ 3032], 80.00th=[ 3163], 90.00th=[ 3359], 95.00th=[ 3589],
     | 99.00th=[ 6587], 99.50th=[ 7570], 99.90th=[15401], 99.95th=[19268],
     | 99.99th=[25297]
   bw (  KiB/s): min= 6558, max=14275, per=100.00%, avg=10047.98, stdev=160.35, samples=2659
   iops        : min=  409, max=  892, avg=627.54, stdev=10.03, samples=2659
  lat (usec)   : 10=0.01%, 100=0.01%, 250=0.01%, 500=0.01%, 750=0.86%
  lat (usec)   : 1000=46.78%
  lat (msec)   : 2=41.63%, 4=10.36%, 10=0.33%, 20=0.03%, 50=0.01%
  lat (msec)   : 100=0.01%
  cpu          : usr=1.48%, sys=3.96%, ctx=1051891, majf=0, minf=139
  IO depths    : 1=100.0%, 2=0.0%, 4=0.0%, 8=0.0%, 16=0.0%, 32=0.0%, >=64=0.0%
     submit    : 0=0.0%, 4=100.0%, 8=0.0%, 16=0.0%, 32=0.0%, 64=0.0%, >=64=0.0%
     complete  : 0=0.0%, 4=100.0%, 8=0.0%, 16=0.0%, 32=0.0%, 64=0.0%, >=64=0.0%
     issued rwts: total=943939,104637,0,0 short=0,0,0,0 dropped=0,0,0,0
     latency   : target=0, window=0, percentile=100.00%, depth=1

Run status group 0 (all jobs):
   READ: bw=87.9MiB/s (92.2MB/s), 87.9MiB/s-87.9MiB/s (92.2MB/s-92.2MB/s), io=14.4GiB (15.5GB), run=167758-167758msec
  WRITE: bw=9980KiB/s (10.2MB/s), 9980KiB/s-9980KiB/s (10.2MB/s-10.2MB/s), io=1635MiB (1714MB), run=167758-167758msec

Disk stats (read/write):
  rbd0: ios=943833/104731, merge=0/51, ticks=941705/314240, in_queue=1255946, util=100.00%


this is more inline of my expectations , slow but not extremly slow.
 
Running the tests in parallell yileds higher total, so it seems that the VM is the most limiting factor here!

1704921703884.png
 
Another observation, starting more benchmarks doesnt affect the performance of a single vm that much. but I can see the increased iops under DC->CEPH . There is high overhead in proxmox/vm .

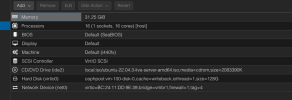
I created a new VM with more vcpu, but more importantly these settings:

1704923800040.png

now the VM performance is closer to lxc, but still limited!

Also as expected increasing worksings increases the iops, so we are latency limited and some vm overhead.


ceph -s output

Bash:
oot@pm1:~# ceph -s
  cluster:
    id:     47a8ff1a-0599-4215-b268-b4c06ef9274e
    health: HEALTH_OK
 
  services:
    mon: 3 daemons, quorum pm3,pm1,pm2 (age 9h)
    mgr: pm3(active, since 10h), standbys: pm1, pm2
    osd: 18 osds: 18 up (since 9h), 18 in (since 9h)
 
  data:
    pools:   2 pools, 33 pgs
    objects: 40.04k objects, 155 GiB
    usage:   484 GiB used, 2.8 TiB / 3.3 TiB avail
    pgs:     33 active+clean
 
  io:
    client:   315 MiB/s rd, 78 MiB/s wr, 20.18k op/s rd, 5.01k op/s wr
 
  progress:
    Global Recovery Event (0s)
      [............................]
 
Last edited:
Hm, what happened to my cpeh cluster ?

1704924779362.png

Bash:
~# ceph -w
  cluster:
    id:     47a8ff1a-0599-4215-b268-b4c06ef9274e
    health: HEALTH_OK
 
  services:
    mon: 3 daemons, quorum pm3,pm1,pm2 (age 10h)
    mgr: pm3(active, since 10h), standbys: pm1, pm2
    osd: 18 osds: 18 up (since 9h), 18 in (since 9h); 10 remapped pgs
 
  data:
    pools:   2 pools, 129 pgs
    objects: 49.04k objects, 191 GiB
    usage:   593 GiB used, 2.7 TiB / 3.3 TiB avail
    pgs:     8040/147132 objects misplaced (5.464%)
             116 active+clean
             8   active+remapped+backfill_wait
             3   active+remapped+backfilling
             2   active+clean+scrubbing+deep
 
  io:
    client:   302 MiB/s rd, 662 MiB/s wr, 15.47k op/s rd, 3.78k op/s wr
    recovery: 302 MiB/s, 76 objects/s
 
  progress:
    Global Recovery Event (9h)
      [=========================...] (remaining: 50m)

rebalance etc?
 
lxc:
Bash:
Cbs: 16 (f=16): [m(16)][31.8%][r=2032KiB/s,w=368KiB/s][r=127,w=23 IOPS][eta 13m:51s]  
fio: terminating on signal 2
Jobs: 16 (f=16): [m(16)][31.8%][eta 13m:54s]                                        
randrw: (groupid=0, jobs=16): err= 0: pid=913: Wed Jan 10 22:15:24 2024
  read: IOPS=3474, BW=54.3MiB/s (56.9MB/s)(20.6GiB/388578msec)
    slat (usec): min=8, max=2021.3k, avg=42.15, stdev=3047.52
    clat (usec): min=3, max=2914.2k, avg=2467.69, stdev=33750.82
     lat (usec): min=462, max=2914.2k, avg=2510.58, stdev=33889.90
    clat percentiles (usec):
     |  1.00th=[    734],  5.00th=[    799], 10.00th=[    840],
     | 20.00th=[    898], 30.00th=[    938], 40.00th=[    979],
     | 50.00th=[   1020], 60.00th=[   1074], 70.00th=[   1188],
     | 80.00th=[   1565], 90.00th=[   3392], 95.00th=[   6390],
     | 99.00th=[  11469], 99.50th=[  14615], 99.90th=[  58983],
     [B]| 99.95th=[ 329253][/B], 99.99th=[2231370]
   bw (  KiB/s): min=  736, max=114552, per=100.00%, avg=63373.99, stdev=1494.93, samples=10919
   iops        : min=   46, max= 7150, avg=3956.12, stdev=93.28, samples=10919
  write: IOPS=868, BW=13.6MiB/s (14.2MB/s)(5272MiB/388578msec); 0 zone resets
    slat (usec): min=15, max=2041.5k, avg=137.02, stdev=12671.92
    clat (msec): min=2, max=2888, avg= 8.19, stdev=35.53
     lat (msec): min=2, max=2888, avg= 8.33, stdev=37.73
    clat percentiles (msec):
     |  1.00th=[    4],  5.00th=[    4], 10.00th=[    4], 20.00th=[    4],
     | 30.00th=[    5], 40.00th=[    5], 50.00th=[    5], 60.00th=[    6],
     | 70.00th=[    8], 80.00th=[   10], 90.00th=[   14], 95.00th=[   17],
     | 99.00th=[   32], 99.50th=[   47], 99.90th=[  292], 99.95th=[  550],
     | 99.99th=[ 2198]
   bw (  KiB/s): min=  543, max=28461, per=100.00%, avg=15900.51, stdev=370.53, samples=10874
   iops        : min=   33, max= 1776, avg=992.60, stdev=23.14, samples=10874
  lat (usec)   : 4=0.01%, 10=0.01%, 50=0.01%, 100=0.01%, 250=0.01%
  lat (usec)   : 500=0.01%, 750=1.22%, 1000=34.89%
  lat (msec)   : 2=30.92%, 4=10.92%, 10=16.96%, 20=4.25%, 50=0.64%
  lat (msec)   : 100=0.06%, 250=0.06%, 500=0.02%, 750=0.01%, 1000=0.02%
  lat (msec)   : 2000=0.01%, >=2000=0.01%
  cpu          : usr=0.52%, sys=1.39%, ctx=1690800, majf=0, minf=320
  IO depths    : 1=100.0%, 2=0.0%, 4=0.0%, 8=0.0%, 16=0.0%, 32=0.0%, >=64=0.0%
     submit    : 0=0.0%, 4=100.0%, 8=0.0%, 16=0.0%, 32=0.0%, 64=0.0%, >=64=0.0%
     complete  : 0=0.0%, 4=100.0%, 8=0.0%, 16=0.0%, 32=0.0%, 64=0.0%, >=64=0.0%
     issued rwts: total=1349995,337396,0,0 short=0,0,0,0 dropped=0,0,0,0
     latency   : target=0, window=0, percentile=100.00%, depth=1


Run status group 0 (all jobs):
   READ: bw=54.3MiB/s (56.9MB/s), 54.3MiB/s-54.3MiB/s (56.9MB/s-56.9MB/s), io=20.6GiB (22.1GB), run=388578-388578msec
  WRITE: bw=13.6MiB/s (14.2MB/s), 13.6MiB/s-13.6MiB/s (14.2MB/s-14.2MB/s), io=5272MiB (5528MB), run=388578-388578msec


Disk stats (read/write):
  rbd0: ios=1349991/337624, merge=0/152, ticks=3301981/2752640, in_queue=6054621, util=99.74%
root@testburk:~#

This stands out!
slat (usec): min=8, max=2021.3k, avg=42.15, stdev=3047.52
clat (usec): min=3, max=2914.2k, avg=2467.69, stdev=33750.82
lat (usec): min=462, max=2914.2k, avg=2510.58, stdev=33889.90


VM:
Bash:
^Cbs: 16 (f=16): [m(16)][42.0%][eta 06m:47s]                                            
fio: terminating on signal 2

randrw: (groupid=0, jobs=16): err= 0: pid=2169: Wed Jan 10 22:15:22 2024
  read: IOPS=6032, BW=94.3MiB/s (98.8MB/s)(27.1GiB/294607msec)
    slat (usec): min=11, max=2415, avg=47.84, stdev=16.90
    clat (usec): min=6, max=2897.3k, avg=2517.01, stdev=29752.79
     lat (usec): min=639, max=2897.4k, avg=2565.78, stdev=29752.78
    clat percentiles (usec):
     |  1.00th=[    947],  5.00th=[   1029], 10.00th=[   1074],
     | 20.00th=[   1139], 30.00th=[   1188], 40.00th=[   1237],
     | 50.00th=[   1303], 60.00th=[   1369], 70.00th=[   1483],
     | 80.00th=[   1827], 90.00th=[   3392], 95.00th=[   6128],
     | 99.00th=[  11076], 99.50th=[  14484], 99.90th=[  55837],
     | 99.95th=[ 160433], 99.99th=[2004878]
   bw (  KiB/s): min=  831, max=162251, per=100.00%, avg=109506.57, stdev=2102.32, samples=8309
   iops        : min=   51, max=10140, avg=6840.44, stdev=131.39, samples=8309
  write: IOPS=1509, BW=23.6MiB/s (24.7MB/s)(6948MiB/294607msec); 0 zone resets
    slat (usec): min=11, max=1248, avg=55.02, stdev=18.85
    clat (usec): min=4, max=5955, avg=240.18, stdev=67.56
     lat (usec): min=93, max=6000, avg=296.19, stdev=72.48
    clat percentiles (usec):
     |  1.00th=[  133],  5.00th=[  157], 10.00th=[  172], 20.00th=[  190],
     | 30.00th=[  204], 40.00th=[  219], 50.00th=[  233], 60.00th=[  247],
     | 70.00th=[  265], 80.00th=[  285], 90.00th=[  318], 95.00th=[  347],
     | 99.00th=[  433], 99.50th=[  478], 99.90th=[  750], 99.95th=[  807],
     | 99.99th=[ 1123]
   bw (  KiB/s): min=  635, max=48243, per=100.00%, avg=27549.95, stdev=565.77, samples=8263
   iops        : min=   35, max= 3014, avg=1719.00, stdev=35.34, samples=8263
  lat (usec)   : 10=0.01%, 20=0.01%, 50=0.01%, 100=0.01%, 250=12.47%
  lat (usec)   : 500=7.46%, 750=0.06%, 1000=2.64%
  lat (msec)   : 2=63.06%, 4=7.72%, 10=5.55%, 20=0.86%, 50=0.09%
  lat (msec)   : 100=0.03%, 250=0.02%, 500=0.01%, 750=0.01%, 1000=0.01%
  lat (msec)   : 2000=0.01%, >=2000=0.01%
  cpu          : usr=1.36%, sys=3.36%, ctx=2223666, majf=0, minf=268
  IO depths    : 1=100.0%, 2=0.0%, 4=0.0%, 8=0.0%, 16=0.0%, 32=0.0%, >=64=0.0%
     submit    : 0=0.0%, 4=100.0%, 8=0.0%, 16=0.0%, 32=0.0%, 64=0.0%, >=64=0.0%
     complete  : 0=0.0%, 4=100.0%, 8=0.0%, 16=0.0%, 32=0.0%, 64=0.0%, >=64=0.0%
     issued rwts: total=1777233,444676,0,0 short=0,0,0,0 dropped=0,0,0,0
     latency   : target=0, window=0, percentile=100.00%, depth=1

Run status group 0 (all jobs):
   READ: bw=94.3MiB/s (98.8MB/s), 94.3MiB/s-94.3MiB/s (98.8MB/s-98.8MB/s), io=27.1GiB (29.1GB), run=294607-294607msec
  WRITE: bw=23.6MiB/s (24.7MB/s), 23.6MiB/s-23.6MiB/s (24.7MB/s-24.7MB/s), io=6948MiB (7286MB), run=294607-294607msec

Disk stats (read/write):
  vda: ios=1777220/444791, merge=0/114, ticks=4421832/114265, in_queue=4551446, util=98.50%

slat (usec): min=11, max=2415, avg=47.84, stdev=16.90
clat (usec): min=6, max=2897.3k, avg=2517.01, stdev=29752.79
lat (usec): min=639, max=2897.4k, avg=2565.78, stdev=29752.78
 
Last edited:

About

The Proxmox community has been around for many years and offers help and support for Proxmox VE, Proxmox Backup Server, and Proxmox Mail Gateway.
We think our community is one of the best thanks to people like you!

Get your subscription!

The Proxmox team works very hard to make sure you are running the best software and getting stable updates and security enhancements, as well as quick enterprise support. Tens of thousands of happy customers have a Proxmox subscription. Get yours easily in our online shop.

Buy now!