ceph latency spikes 2-3 times per day

RobFantini

Famous Member
May 24, 2012
2,009
102
133
Boston,Mass
Hello
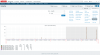
we are using zabbix graphs to monitor ceph latency. see attached example .
currently we have just seven 2-TB P3700 nvme drives active.

at the time of spikes there is very little activity by users or cronjobs. zabbix network graphs show below average activity at the time of most spikes.

To try to see if there is bad hardware, we'd like to set up per osd latency history data. Does anyone have suggestions on how to do so?
 

Attachments

  • zabbix_Custom_graphs_refreshed_every_30_sec.png
    zabbix_Custom_graphs_refreshed_every_30_sec.png
    253.9 KB · Views: 9
How do you gather the data? The Ceph manager should be providing this data already.

Tho have a quick look you can issue the following command on the respective nodes.
Code:
ceph daemon osd.<ID> dump_historic_slow_ops
 
How do you gather the data? The Ceph manager should be providing this data already.

the data is sent by ceph. i followed parts of https://docs.ceph.com/docs/master/mgr/zabbix/ . only use template from debian package. at pve
Code:
# ceph zabbix config-show
{"zabbix_port": 10051, "zabbix_host": "10.1.3.55", "identifier": "ceph-pve.localdomain.com", "zabbix_sender": "/usr/bin/zabbix_sender", "interval": 60}
i have a local wiki page with close to complete setup info including pic of zabbix config. let me know if wanted.
Tho have a quick look you can issue the following command on the respective nodes. [CODE said:
ceph daemon osd.<ID> dump_historic_slow_ops[/CODE]

thanks for that!
 
I have a couple of questions related to tracker. i did a search and am unsure..
Code:
# ceph daemon osd.0 dump_historic_slow_ops
op_tracker tracking is not enabled now, so no ops are tracked currently, even those get stuck. Please enable "osd_enable_op_tracker", and the tracker will start to track new ops received afterwards.
so it need to be enabled in ceph.conf withthis at the osd section
Code:
osd_enable_op_tracker = "true"

questions:
1- does the need to be set?
Code:
# at global section
debug optracker = 0/0


2- could you remind me how to push those setting in a running ceph system or do I need to restart services?
 
Did you resolve all questions? Or still some open?
 

About

The Proxmox community has been around for many years and offers help and support for Proxmox VE, Proxmox Backup Server, and Proxmox Mail Gateway.
We think our community is one of the best thanks to people like you!

Get your subscription!

The Proxmox team works very hard to make sure you are running the best software and getting stable updates and security enhancements, as well as quick enterprise support. Tens of thousands of happy customers have a Proxmox subscription. Get yours easily in our online shop.

Buy now!