I've installed Proxmox/CEPH 6.0 on 5 Dell R740XD servers. Each has (16) 8TB spinners and 1 Supermicro NVMe card with a 4TB Samsung NVMe drive. During the OSD creation I allocated 1/16 of the NVMe to the DB of each 8TB OSD. After creating the 80 OSDs I see a CEPH usage of 3%, 17.5TB of 599TB. This appears to be 5*3.5TB, the capacity of the the DB cache. Is this to be expected or is this usage something else?
CEPH disk usage
- Thread starter Adam Koczarski
- Start date
You are using an out of date browser. It may not display this or other websites correctly.
You should upgrade or use an alternative browser.
You should upgrade or use an alternative browser.
Thanks Alwin. I see usage listed as LVM for my NVMe drive. I used the GUI to create my OSDs and divided the 3.54TB NVMe by 16 to match the number of OSDs. Therefore I specified 220GB of capacity for each OSD. How would this 220GB be divided between the DB and WAL? I did not specify the -db_size and -wal_size paremeters in my ceph.conf.
Thx
Thx
Been running some MS Diskspd tests on a Windows 10 VM with this setup. Not as good as hoped for.
With write back
26.8 MiB/s read, 11.5 MiB/s write 8k
228.6 MiB/s read, 97.7 MiB/s write 256k
Without write back
18.9 MiB/s read, 8.1 MiB/s write 8k
167 MiB/s read, 71.4 MiB/s write 256k
rados -p testpool bench 60 write --no-cleanup
Total time run: 60.0607
Total writes made: 16233
Write size: 4194304
Object size: 4194304
Bandwidth (MB/sec): 1081.11
Stddev Bandwidth: 29.6153
Max bandwidth (MB/sec): 1140
Min bandwidth (MB/sec): 964
Average IOPS: 270
Stddev IOPS: 7.40383
Max IOPS: 285
Min IOPS: 241
Average Latency(s): 0.0591925
Stddev Latency(s): 0.0154779
Max latency(s): 0.313585
Min latency(s): 0.02908
rados -p testpool bench 60 seq
Total time run: 44.9582
Total reads made: 16233
Read size: 4194304
Object size: 4194304
Bandwidth (MB/sec): 1444.27
Average IOPS: 361
Stddev IOPS: 10.1474
Max IOPS: 385
Min IOPS: 335
Average Latency(s): 0.0436273
Max latency(s): 0.307046
Min latency(s): 0.0116947
Last edited:
If not specified, the WAL is located with the DB on the same LV or partition. It usually is ~512MB long.Therefore I specified 220GB of capacity for each OSD. How would this 220GB be divided between the DB and WAL?
Ceph is a better target for concurrent read/writes of multiple clients.Been running some MS Diskspd tests on a Windows 10 VM with this setup. Not as good as hoped for.
While the benchmark was made with Luminous, find the Ceph Benchmark Paper and discussion for comparison in the link below.
https://forum.proxmox.com/threads/proxmox-ve-ceph-benchmark-2018-02.41761/
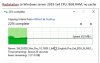
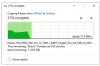
Further testing with this new cluster. When I copy 15GB folder containing three ISO files from our Synology 10Gbps NAS to my Windows VM desktop the throughput starts out around 800 to 900 MB/s but then hits a wall and drops to about 20MB/s. This is a 5 node cluster with 18 8TB SATA drives per node with 220GB of NVMe assigned to each drive for the journal. I could see this happening if I was over running the cache, but 15GB is far less than the 220GB NVMe per OSD. Copying the same files from the NAS to a physical Windows server with a 1 Gbps LAN connection yields a constant 120MB/s as expected. The Proxmox/CEPH VM drops to 1/6th of the throughput relative to the physical server??
Any idea where/how to start tracking down the possible bottleneck?
Any idea where/how to start tracking down the possible bottleneck?
Attachments
with 80 OSD you should able to achieve 11 GiB/s,
I have 96 OSD setup accross 8 nodes and it is capable of achieving following throughput

I have 96 OSD setup accross 8 nodes and it is capable of achieving following throughput
What test are you running to get those "client throughput" results? Throughput from where to where? What type of drives?
I'm copying from a NAS to a Windows client over a 10Gbps network so 1GB/s is all I'm hoping for, but not achieving. The first 5GB are copied at the expected speed but then it hits a wall.
Thx
I'm copying from a NAS to a Windows client over a 10Gbps network so 1GB/s is all I'm hoping for, but not achieving. The first 5GB are copied at the expected speed but then it hits a wall.
Thx
Here are my rados results for the tests shown. I don't see a "client throughput" or iops that high?? Not sure what could be going on with my config. Just trying to get an idea of where to start looking...
| rados -p testpool bench 60 write -b 4M -t16 --no-cleanup | |
| Total time run: | 60.2513 |
| Total writes made: | 15602 |
| Write size: | 4194304 |
| Object size: | 4194304 |
| Bandwidth (MB/sec): | 1035.8 |
| Stddev Bandwidth: | 36.567 |
| Max bandwidth (MB/sec): | 1120 |
| Min bandwidth (MB/sec): | 904 |
| Average IOPS: | 258 |
| Stddev IOPS: | 9.14176 |
| Max IOPS: | 280 |
| Min IOPS: | 226 |
| Average Latency(s): | 0.061689 |
| Stddev Latency(s): | 0.022141 |
| Max latency(s): | 0.500857 |
| Min latency(s): | 0.026936 |
| rados -p testpool bench 60 seq | |
| Total time run: | 5.72688 |
| Total reads made: | 2386 |
| Read size: | 4194304 |
| Object size: | 4194304 |
| Bandwidth (MB/sec): | 1666.53 |
| Average IOPS: | 416 |
| Stddev IOPS: | 22.5499 |
| Max IOPS: | 455 |
| Min IOPS: | 407 |
| Average Latency(s): | 0.037425 |
| Max latency(s): | 0.376175 |
| Min latency(s): | 0.002893 |
| rados -p testpool bench 60 rand | |
| Total time run: | 60.0453 |
| Total reads made: | 25713 |
| Read size: | 4194304 |
| Object size: | 4194304 |
| Bandwidth (MB/sec): | 1712.91 |
| Average IOPS: | 428 |
| Stddev IOPS: | 15.196 |
| Max IOPS: | 466 |
| Min IOPS: | 395 |
| Average Latency(s): | 0.036707 |
| Max latency(s): | 1.06882 |
| Min latency(s): | 0.002483 |
1035.8 mb/s is your throughput..
1666.53 mb/s for seq single client is very nice
I am getting my results from ceph manager dashboard
1666.53 mb/s for seq single client is very nice
I am getting my results from ceph manager dashboard
The VM has 8 GiB of memory, Windows will cache writes. It seems that around 4 GiB in the transfer the cache got exhausted. The KVM process runs with a single IO thread, contrary to rados bench (16T). Especially for small writes, it is advisable to enable the disk cache on the VM, this will in turn activate Ceph's cache for the VMs writes.Further testing with this new cluster. When I copy 15GB folder containing three ISO files from our Synology 10Gbps NAS to my Windows VM desktop the throughput starts out around 800 to 900 MB/s but then hits a wall and drops to about 20MB/s. This is a 5 node cluster with 18 8TB SATA drives per node with 220GB of NVMe assigned to each drive for the journal. I could see this happening if I was over running the cache, but 15GB is far less than the 220GB NVMe per OSD. Copying the same files from the NAS to a physical Windows server with a 1 Gbps LAN connection yields a constant 120MB/s as expected. The Proxmox/CEPH VM drops to 1/6th of the throughput relative to the physical server??
If you are not using filestore OSDs, then the journal is actually the DB/WAL and is the OSDs database that holds the metadata for the objects written. While small write may go directly to the NVMe, others land on the spinner. So it doesn't really function the way as filestore journals do.
I suppose that the physical Windows server has more memory and doesn't share IO with other OSes on the server.
The VM has 8 GiB of memory, Windows will cache writes. It seems that around 4 GiB in the transfer the cache got exhausted. The KVM process runs with a single IO thread, contrary to rados bench (16T). Especially for small writes, it is advisable to enable the disk cache on the VM, this will in turn activate Ceph's cache for the VMs writes.
If you are not using filestore OSDs, then the journal is actually the DB/WAL and is the OSDs database that holds the metadata for the objects written. While small write may go directly to the NVMe, others land on the spinner. So it doesn't really function the way as filestore journals do.
I suppose that the physical Windows server has more memory and doesn't share IO with other OSes on the server.
Thanks for the reply Alwin!
1. Increasing the RAM on the Windows VM did indeed allow me to get through my copy process without hitting the wall. Of course, doubling the size of the copy process got me back to a wall, but further on in the process.
") I now understanding the caching going on on my Windows VMs.
I now understanding the caching going on on my Windows VMs.2. If I enable caching on the VM you says this in turn will activate Ceph's cache for VM writes.
2a. Is the ceph cache just enabled for the one VM I enable the cache for, or will this enable ceph caching for all VMs?
2b. Is the ceph caching you are referring too the DB/WAL journaling, or is this ceph caching something else?
3. I am using bluestore, so I assume your statement means my NVMe DB/WAL should be in play??
4. Under what circumstances would writes go straight to the spinners? One would think everything would go through the NVMe until it fills. Is this not correct?
Again, thanks for the info. This really helps me start to understanding everything in play with a setup like this. Until now my Proxmox/CEPH testing has been all POC systems with inferior hardware. My current cluster is my first exposure to the real thing.

Yes [0] and the rbd cache itself is already enabled see the important note [1].2. If I enable caching on the VM you says this in turn will activate Ceph's cache for VM writes.
2a. Is the ceph cache just enabled for the one VM I enable the cache for, or will this enable ceph caching for all VMs?
I should have been more precise, it is actually the RBD cache and has nothing to do with the DB/WAL. Different layer.2b. Is the ceph caching you are referring too the DB/WAL journaling, or is this ceph caching something else?
Not sure what you mean, but Bluestore [2] needs a DB (rocksDB) to function.3. I am using bluestore, so I assume your statement means my NVMe DB/WAL should be in play??
Not correct, see the blog article on how bluestore [2] works. As said, the NVMe holds the database for metdata and the data itself are written to the spinner.4. Under what circumstances would writes go straight to the spinners? One would think everything would go through the NVMe until it fills. Is this not correct?
[0] https://docs.ceph.com/docs/nautilus/rbd/qemu-rbd/#qemu-cache-options
[1] https://docs.ceph.com/docs/nautilus/rbd/qemu-rbd/#running-qemu-with-rbd
[2] https://ceph.com/community/new-luminous-bluestore/
@Alwin Thank you for the detailed explanations. I have a couple questions about some of them.
Question 1:
When @Adam Koczarski created his 220GB partitions on the NVMe and then used the Proxmox GUI to create the OSD's and designate the DB/WAL location to these partitions is this still true?
from the referenced blog post:
"By default a partition will be created on the sdc device that is 1% of the main device size. This can be overridden with the bluestore_block_db_size config option."
....or... since he manually created the 220GB partition it will use ALL 220GB without the need to tweak the bluestore_block_db_size to match?
Question 2:
"In BlueStore, the internal journaling needed for consistency is much lighter-weight, usually behaving like a metadata journal and only journaling small writes when it is faster (or necessary) to do so..."
By default, how are the decisions to land writes or source reads on/from the faster NVMe vs the backing spinners made with bluestore?
Based on what you've stated above and this from the blog you referenced it seems that, at least with RBD, there is no way to speed up DATA reads and writes to the backing HDD's without relying on the guests OS's built in cache or the hypervisor's cache setting for the disk of the VM (or both)...because all data needs to hit the backing storage (the HDD/Spinner's in Adam's case) before being released.
There's been a constant debate around the confusion involving performance, caching and where the DB/WAL fits into all of this at my site. Thanks again for the time.
<D>
Last edited:
pveceph (uses ceph-volume underneath) will usually create a partition if pointed to a disk and use a partition if pointed to a partition. The 'bluestore_block_db_size' is used when creating partitions.....or... since he manually created the 220GB partition it will use ALL 220GB without the need to tweak the bluestore_block_db_size to match?
WAL (write ahead log) is part of RocksDB, but the checksums for the objects are stored in the DB. Wasn't the case with the previous backend 'filestore'."In BlueStore, the internal journaling needed for consistency is much lighter-weight, usually behaving like a metadata journal and only journaling small writes when it is faster (or necessary) to do so..."
When DB/WAL is located on the NVMe, only the data portion of the object lands on the spinner. Metadata is located in the DB.By default, how are the decisions to land writes or source reads on/from the faster NVMe vs the backing spinners made with bluestore?
Reading data from Ceph is probably not the concern, as this will be done in parallel from all OSDs involved of a PG (replica count). Writing also needs to got to all participating OSDs of a PG. The client only talks to one OSD, the primary for the PG. And this OSD will send the data to the other OSDs involved. Only after that the ACK will be send to the client. This ensures that all copies are written, but in turn makes the write process slower. Caching has the effect that writes/reads (depending on cache setting) don't need to travel over the network to be surfed, hence reduce the latency.Based on what you've stated above and this from the blog you referenced it seems that, at least with RBD, there is no way to speed up DATA reads and writes to the backing HDD's without relying on the guests OS's built in cache or the hypervisor's cache setting for the disk of the VM (or both)...because all data needs to hit the backing storage (the HDD/Spinner's in Adam's case) before being released.