ceph 3 node cluster Windows guests at 100% disk i/o

zaphyre

Member
Oct 6, 2020
55
4
13
35
Hi, I am currently operating a 3 node PVE 7.0 & Ceph (cluster based on 10*NVMe/ 10*SATA-SSDs in each node). The CEPH network is a dedicated 100GbEthernet link.

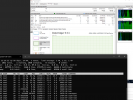
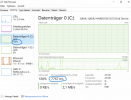
In Windows guests the disk perfomance is maxing out at a 100% disk usage and the latency is at multiple hundred up to several thousand miliseconds making the guests systems absolutely unresponsive...

This is not the normal behavior. I checked for scrubbing/deep-scrubbing at the PVE nodes, but there is currently no operation running (all PGs are active+clean). Ceph health shows HEALTH_OK. Reads/Writes are at around 5 MiB/s and IOPS at around 100 on "PVE -Datacenter - Ceph" screen. OSDs are all under 30% usage.

The guests use VirtIO SCSI controller and IDE disks, no caching and Discard is on. The guest itself is idle. I updated the virtio-drivers to the current version without any changes...
ceph.png

Any help where to start diagnosing the issue?

Thanks a lot.
 
Can you show the VM config? qm config xxx
 
Sure @aaron , here it is:

Code:
root@xxx-xxx-xxx:~# qm config 111
agent: 1
balloon: 8192
bios: ovmf
boot: order=scsi0
cores: 8
description: ## ...
efidisk0: ceph-ssd:vm-111-disk-0,efitype=4m,pre-enrolled-keys=1,size=528K
hostpci0: 0000:e1:00,pcie=1,x-vga=1
machine: pc-q35-6.0
memory: 65536
name: xxx-xxx-xxx-xx
net0: virtio=AA:CF:2B:F0:19:92,bridge=vmbr0,firewall=1
numa: 1
onboot: 1
ostype: win10
scsi0: ceph-nvme:vm-111-disk-0,discard=on,size=250G
scsi1: ceph-nvme:vm-111-disk-1,discard=on,size=250G
scsihw: virtio-scsi-pci
smbios1: uuid=47a4c931-6482-47c2-869d-dec5d538303a
sockets: 1
tablet: 1
tpmstate0: ceph-ssd:vm-111-disk-1,size=4M,version=v2.0
vga: virtio,memory=64
vmgenid: c51d36e2-51ae-40f6-bcbe-9ad4f9ffa1dc
 
Do you see a high IO delay on the PVE node itself as well?
Is there a backup of the VM going on when the delay is going up that high?

You could also try to enable "IO Threading" for the disks (needs Virtio-SCSI-single). That would create a single thread for each SCSI disk in the VM handling it, in case the issue is CPU bound.
Looking at the "wa" colum n from top I'd say there is no I/O wait on the host. Is top okay for checking for IO delay on the PVE host? Or what yould you suggest? iostat?

There is currently no backup running.
The guest is mostly above several hundreds or thounds milisseconds latency for a few hundred KB/s. Which makes the guest "slow".

Please have a look at the attached screenshot.

3Screenshot 2022-03-02 122554.png

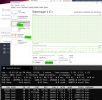
When downloading an ISO Image from this VM I get around 90 MBit/s from the network and around 8.5. MB/s to the disk but also at around 100% disk usage and with high response times. Please see second screenshot:

5Screenshot 2022-03-02 124311.png

This machine is a Windows 10 Enterprise and has a vTPM chip could something like the Bitlocker disk encryption or some other security feature like nested virtualization secure boot or so kill the IO perfromance?

For your suggestion regarding IO thread can I just check the box "IO thread" for the harddsik and reboot the vm?


Thanks a ton!
 
Is top okay for checking for IO delay on the PVE host? Or what yould you suggest? iostat?
should be okay. Looking at the summary panel of the node itself, you have a graph of the IO delay the node sees. That can also be helpful if you don't have another monitoring set up that would track this.


For your suggestion regarding IO thread can I just check the box "IO thread" for the harddsik and reboot the vm?
Don't forget to set the SCSI controller to the Virtio single variant as well.


Another thing you can check is how the OSDs are doing.

Run the following command and compare the output. If you have one or two OSDs that are performing much worse than the others in their device class, they could cause some issues as well.
Bash:
ceph tell osd.* benc
 
Another thing you can check is how the OSDs are doing.

Run the following command and compare the output. If you have one or two OSDs that are performing much worse than the others in their device class, they could cause some issues as well.
Bash:
ceph tell osd.* bench


Thanks a lot @aaron this helps!,

will 1st) set the vm to "VirtIO SCSI single" and then activate "IO thread" on the corresponding SCSI device for this VM. Besides I`ll try to set cache from "Default" to "Write back" on this disk.

then 2nd) look for abnormalities in ceph tell osd.* bench.

Is there an easy way to see if/how Ceph uses the host systems RAM for caching osds? I have read that there is a default 1G for SSD and 3G per NVMe if I remember correctly? Maybe my host is overcommited its RAM? Can I see this caches utilization? I am alwys confused with RAM consumption wehn using balloning devices, so does ceph has an info about this caching?

Thanks in advance,
best regards
zaph
 
You can run top, at the top you have 2 lines regarding memory where you will see how much physical memory is available, actually free, used, used by buffers and caches and so forth. That gives you and overview how much physical memory is used on that node.

If you check for processes, the RES column is what is actually used in physical memory by that process.
 

About

The Proxmox community has been around for many years and offers help and support for Proxmox VE, Proxmox Backup Server, and Proxmox Mail Gateway.
We think our community is one of the best thanks to people like you!

Get your subscription!

The Proxmox team works very hard to make sure you are running the best software and getting stable updates and security enhancements, as well as quick enterprise support. Tens of thousands of happy customers have a Proxmox subscription. Get yours easily in our online shop.

Buy now!