Best way to monitor disk read/write usage of ZFS?
- Thread starter NoSum
- Start date
You are using an out of date browser. It may not display this or other websites correctly.
You should upgrade or use an alternative browser.
You should upgrade or use an alternative browser.
I am unable to get any tools to easily show disk usage this is ZFS "iotop" commandwhat exactly do you need? you can get per vm stats via the api/cli e.g. 'qm status ID --verbose'
and general zfs stats via 'zpool iostat'
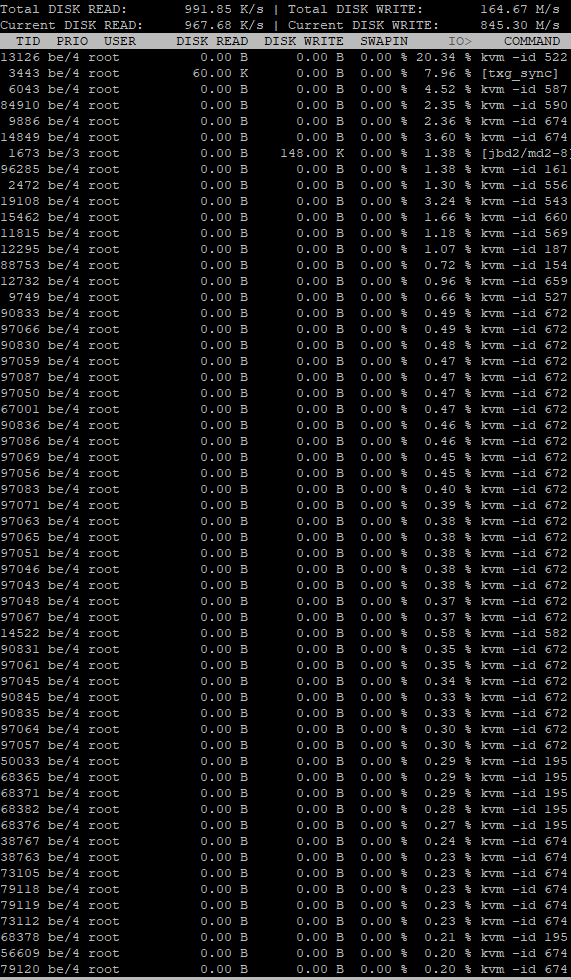
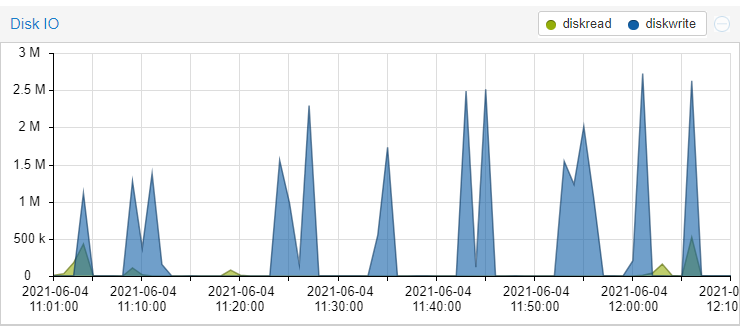
This does show VM 522 is using 20% IO but if I look at it's graph it is not the VM using the main resources
None of the running KVM machines show correct disk read/write always 0/0 where as without ZFS iotop easily shows which VM is using what
The zpool commands are overall usage I need to easily be able to detect which virtual machine maybe abusing disk resources (read/write) without having to manually check every virtual machines Disk IO graph in the Proxmox GUI.
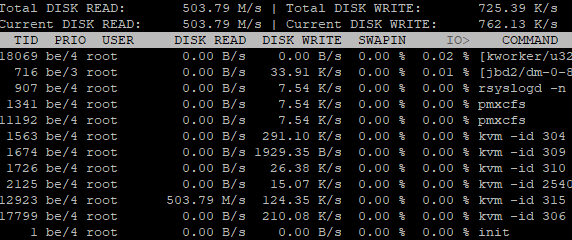
i cannot reproduce that here, when my vm with disks on zfs does io (e.g. with fio) it normally shows up in iotop
can you post the output of pveversion -v ?
Code:
pveversion -v
proxmox-ve: 6.4-1 (running kernel: 5.4.114-1-pve)
pve-manager: 6.4-6 (running version: 6.4-6/be2fa32c)
pve-kernel-5.4: 6.4-2
pve-kernel-helper: 6.4-2
pve-kernel-5.4.114-1-pve: 5.4.114-1
ceph-fuse: 12.2.11+dfsg1-2.1+b1
corosync: 3.1.2-pve1
criu: 3.11-3
glusterfs-client: 5.5-3
ifupdown: residual config
ifupdown2: 3.0.0-1+pve3
ksm-control-daemon: 1.3-1
libjs-extjs: 6.0.1-10
libknet1: 1.20-pve1
libproxmox-acme-perl: 1.1.0
libproxmox-backup-qemu0: 1.0.3-1
libpve-access-control: 6.4-1
libpve-apiclient-perl: 3.1-3
libpve-common-perl: 6.4-3
libpve-guest-common-perl: 3.1-5
libpve-http-server-perl: 3.2-2
libpve-storage-perl: 6.4-1
libqb0: 1.0.5-1
libspice-server1: 0.14.2-4~pve6+1
lvm2: 2.03.02-pve4
lxc-pve: 4.0.6-2
lxcfs: 4.0.6-pve1
novnc-pve: 1.1.0-1
proxmox-backup-client: 1.1.6-2
proxmox-mini-journalreader: 1.1-1
proxmox-widget-toolkit: 2.5-4
pve-cluster: 6.4-1
pve-container: 3.3-5
pve-docs: 6.4-2
pve-edk2-firmware: 2.20200531-1
pve-firewall: 4.1-3
pve-firmware: 3.2-3
pve-ha-manager: 3.1-1
pve-i18n: 2.3-1
pve-qemu-kvm: 5.2.0-6
pve-xtermjs: 4.7.0-3
pve-zsync: 2.1-1
qemu-server: 6.4-2
smartmontools: 7.2-pve2
spiceterm: 3.1-1
vncterm: 1.6-2
zfsutils-linux: 2.0.4-pve1ok looks good, are you sure you did not misinterpret the values from iotop?
the 'IO' percentage is not the percent of the disk that is used, but the percentage of the cpu time of the process that waits for io (see man iotop)
maybe the tool 'atop' is helpful for you? (you have to install it with 'apt install atop' though)
the 'IO' percentage is not the percent of the disk that is used, but the percentage of the cpu time of the process that waits for io (see man iotop)
maybe the tool 'atop' is helpful for you? (you have to install it with 'apt install atop' though)