[SOLVED] After power outage, two nodes (kind of) offline

danb35

Renowned Member
Oct 31, 2015
84
5
73
I had a power outage for about an hour this afternoon, which took down three nodes of my four-node cluster (creatively enough, the nodes are named pve1, pve2, and pve3; pve4 was on a different UPS and wasn't affected). After bringing them back up, pve1 and pve2 are in a semi-offline status:
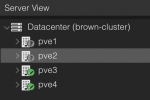
1693430843717.png
I can SSH to each of these nodes, and I can log into the PVE web UI on each of these nodes (the screen shot above is while logged into pve1, but I see the same when logged into pve3). Both of them are up in Ceph--in fact, they're the only ones that are up in Ceph.

On a hunch, I checked the date on these nodes, and found it was way out--like over six weeks behind (IIRC, it was showing a date of 13 Jul 23). The hardware clock was even worse, reading somewhere in 2010. So I used chronyd to forcibly resync the time to my NTP server, then hwclock to set the hardware clock to the system clock. After a reboot, pve1 showed the green checkmark for a short time, then reverted to the gray question mark--pve2 stayed at the question mark. System and hardware date/time are correct on pve3 and pve4.

All four nodes are running 8.0.4 with all updates through about a week ago. Each node can ping any of the others. Scrubs of the boot pools find no errors. I'm kind of baffled here--what else should I be checking?
 
Last edited:
I'm not sure if this is progress or not--restarting pvestatd on the affected nodes brought them online (i.e., green check mark), but only for about a minute. After that, they reverted to the gray question mark shown above. Restarting the whole node brought it online for a slightly longer time--perhaps 5-10 minutes--but then it once again reverted to the gray question mark.
 
Last edited:
Hello
Maybe there is something in the logs. Can you post the journalctl -b after you ssh to pve1 ?
 
It's 265 KB, so can't post it inline, but it's attached. Thanks.
 

Attachments

  • log.txt
    264.8 KB · Views: 4
hmmm... there is something going on with your ceph cluster. Can you see what pveceph status is saying on pve1?
 
  • Like
Reactions: danb35
Code:
root@pve1 ➜  ~ pveceph status
  cluster:
    id:     9e9a1f45-4882-4324-b208-fda9e78e73a4
    health: HEALTH_WARN
            Module 'dashboard' has failed dependency: PyO3 modules may only be initialized once per interpreter process
            clock skew detected on mon.pve3, mon.pve1
            Reduced data availability: 28 pgs inactive
            Degraded data redundancy: 567917/1530219 objects degraded (37.113%), 126 pgs degraded, 126 pgs undersized
            573682 slow ops, oldest one blocked for 51937 sec, mon.pve3 has slow ops

  services:
    mon: 3 daemons, quorum pve2,pve3,pve1 (age 108m)
    mgr: pve2(active, since 14h), standbys: pve1
    osd: 5 osds: 3 up (since 108m), 3 in (since 14h); 29 remapped pgs

  data:
    pools:   2 pools, 129 pgs
    objects: 510.07k objects, 1.9 TiB
    usage:   3.4 TiB used, 3.9 TiB / 7.3 TiB avail
    pgs:     21.705% pgs not active
             567917/1530219 objects degraded (37.113%)
             3991/1530219 objects misplaced (0.261%)
             99 active+undersized+degraded
             17 undersized+degraded+remapped+backfill_wait+peered
             10 undersized+degraded+remapped+backfilling+peered
             2  active+clean+remapped
             1  peering

  io:
    recovery: 41 MiB/s, 11 objects/s

Edit: it looks like at least one problem is that the clocks aren't synced among all the nodes. I'm not sure why this is the case; chronyd is running on all nodes in the cluster. I'd thought I had them all set to sync to my local NTP server, but that doesn't seem to have been the case--I've now updated the chrony configuration on all the nodes to do this. But pveceph status is still showing the clock skew warning.
 
Last edited:
There are 2 issues
  • Your time is still sewed
  • 2 out of your 5 osds are not running
also it looks like pvestatd is not reporting. What does pvestatd status and pvecm status say?
 
  • Like
Reactions: danb35
Code:
root@pve1 ➜  ~ pvestatd status
running
root@pve1 ➜  ~ pvecm status
Cluster information
-------------------
Name:             brown-cluster
Config Version:   4
Transport:        knet
Secure auth:      on

Quorum information
------------------
Date:             Thu Aug 31 07:48:42 2023
Quorum provider:  corosync_votequorum
Nodes:            4
Node ID:          0x00000001
Ring ID:          1.19de6
Quorate:          Yes

Votequorum information
----------------------
Expected votes:   4
Highest expected: 4
Total votes:      4
Quorum:           3
Flags:            Quorate

Membership information
----------------------
    Nodeid      Votes Name
0x00000001          1 192.168.1.3 (local)
0x00000002          1 192.168.1.4
0x00000003          1 192.168.1.5
0x00000004          1 192.168.1.6

By comparison, on one of the "green" nodes:
Code:
root@pve3 ➜  ~ pvestatd status
running
root@pve3 ➜  ~ pvecm status
Cluster information
-------------------
Name:             brown-cluster
Config Version:   4
Transport:        knet
Secure auth:      on

Quorum information
------------------
Date:             Thu Aug 31 07:49:47 2023
Quorum provider:  corosync_votequorum
Nodes:            4
Node ID:          0x00000003
Ring ID:          1.19de6
Quorate:          Yes

Votequorum information
----------------------
Expected votes:   4
Highest expected: 4
Total votes:      4
Quorum:           3
Flags:            Quorate

Membership information
----------------------
    Nodeid      Votes Name
0x00000001          1 192.168.1.3
0x00000002          1 192.168.1.4
0x00000003          1 192.168.1.5 (local)
0x00000004          1 192.168.1.6
 
Everything else looks fine. As a next step you should probably try to get all osds up
 
  • Like
Reactions: danb35
tl;dr: it seems to be working.

I'd tried bringing up the other OSDs through the web interface previously, and it appeared to succeed, but they didn't actually come up. But when I checked pveceph status again, the time skew warning was gone--perhaps it just took ceph some time to realize the nodes' clocks were all matching? And this time, I was able to in/up the missing OSDs, whereupon pve1 and pve2 (after a brief delay) came up green, their VMs/CTs started, and all seems to be good.

The only thing I've changed since starting this thread is to change chronyd.conf to point to my local NTP server, rather than 2.pool.debian.org. It's surprising that a pool server would leave the time out of sync badly enough to cause problems, but that's what it looks like.
 
It's now been up nearly 24 hours without a problem--sounds like it's solved. Thanks for the help.
 

About

The Proxmox community has been around for many years and offers help and support for Proxmox VE, Proxmox Backup Server, and Proxmox Mail Gateway.
We think our community is one of the best thanks to people like you!

Get your subscription!

The Proxmox team works very hard to make sure you are running the best software and getting stable updates and security enhancements, as well as quick enterprise support. Tens of thousands of happy customers have a Proxmox subscription. Get yours easily in our online shop.

Buy now!