About datastore usage

diaolin

Renowned Member
Jul 7, 2008
332
8
83
Trentino Italy
Hi folks,
i have two datastores inside a mountpoint
like /backup is /dev/sdb1

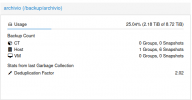
datastore /backup/archivio is archivio
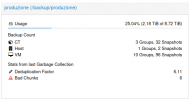
datastore /backup/produzione is produzione

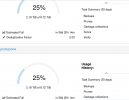
the two datastore gives to me the same occupation because they are on the same disk
but the informaton is not good enough if you take a look at the attached images

The datastore one is the full datastore
the other are separated datastores.

I understand that this could be a good solution but i cannot see hown many data uses each datastore
if i launch
du -sh /backup/archivio i've the good result 716G
and
du -sh /backup/produzione gives to me 1.5T

Is there a way to have a similar result in the interface?
Making two datastores on two separate disks is not a solution for me.


Tx anyway, Diaolin
 

Attachments

  • Archivio.png
    Archivio.png
    23.6 KB · Views: 12
  • Produzione.png
    Produzione.png
    25.1 KB · Views: 12
  • Datastore.png
    Datastore.png
    37.7 KB · Views: 13
Is there a way to have a similar result in the interface?
no that is currently not possible

gathering that information with e.g. du (or similar) is very costly since we would have to iterate over all chunks to get their size.
This is not something that we want to do regularly to avoid io load. Also we do not want to cache that information since
then users might not notice it getting really full.

But why exactly is it a problem when we show the size of the filesystem?
 
  • Like
Reactions: diaolin
no that is currently not possible

gathering that information with e.g. du (or similar) is very costly since we would have to iterate over all chunks to get their size.
This is not something that we want to do regularly to avoid io load. Also we do not want to cache that information since
then users might not notice it getting really full.

But why exactly is it a problem when we show the size of the filesystem?
Is not a problem but i have no idea about the size of the single datastore...
 
Is not a problem but i have no idea about the size of the single datastore...

you can do a garbage collect and in the task-log, there will be the info:
On-Disk usage: 151.00 GiB (6.51%)

we just don't want to show this value constantly on the ui, because it will be outdated very fast...
 
That "On-Disk usage" information should be easily available in the UI with a timestamp indicating when was that information updated (which will be the last time a garbage collection ran). Something like "Estimated disk usage at YYYY-MM-DD HH:MM".

It is going to be outdated exactly as fast as if it was not shown in the UI, but we could find it much easier than having to read logs for the last garbage collection of every datastore.
 
  • Like
Reactions: diaolin
I'm returning to the problem

I see in the datastore summary a nice information like
Deduplication factor

Is it possible to see even the entire table (if converted in MB would be better)
generated by proxmox-backup-manager garbage-collection status $datastore ?

with the date of the Garbage collection could be enough

This could be a good solution, for me.

Anyway thanks, at this moment i've resolved with a simple

#!/bin/bash for datastore in mydata1 mydata2 mydata3 do echo "Datastore ${datastore} usage: $[$(proxmox-backup-manager garbage-collection status ${datastore} | awk '/disk-bytes/{print $4}')/1024/1024/1024] GB" >report${datastore}.txt done

and i mail the report to my customer

Tx, anyway
 
Is it possible to see even the entire table (if converted in MB would be better)
generated by proxmox-backup-manager garbage-collection status $datastore ?
adding that should not be hard, idk if we add it though.
maybe a button that shows that info in a window or something like that?

could you maybe open an enhancement request? https://bugzilla.proxmox.com
 
  • Like
Reactions: diaolin
That "On-Disk usage" information should be easily available in the UI with a timestamp indicating when was that information updated (which will be the last time a garbage collection ran). Something like "Estimated disk usage at YYYY-MM-DD HH:MM".

It is going to be outdated exactly as fast as if it was not shown in the UI, but we could find it much easier than having to read logs for the last garbage collection of every datastore.
we could do that, see my previous answer for a suggestion (sorry for the late response, must have missed your answer)
 
I think that simply showing the table would be enough
No button no popups...
imho that space is already crowded, so i am not really fond of adding the whole gc stats there. an additional panel could also work though
 

About

The Proxmox community has been around for many years and offers help and support for Proxmox VE, Proxmox Backup Server, and Proxmox Mail Gateway.
We think our community is one of the best thanks to people like you!

Get your subscription!

The Proxmox team works very hard to make sure you are running the best software and getting stable updates and security enhancements, as well as quick enterprise support. Tens of thousands of happy customers have a Proxmox subscription. Get yours easily in our online shop.

Buy now!