40% CPU Usage after PVE8 to PVE9 upgrade

voltaiac

New Member
Oct 22, 2025
9
1
3
Hi all,

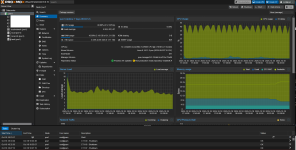
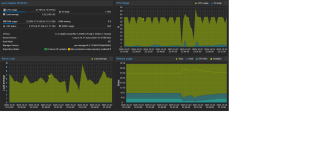
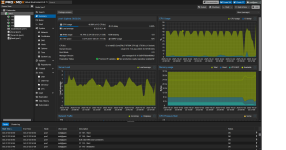
I recently upgraded Proxmox from 8 to 9 (with no errors), only there seems to be some kind of background process running that is taking up anywhere from 38-44% CPU usage on top of my other processes.

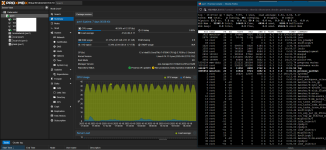
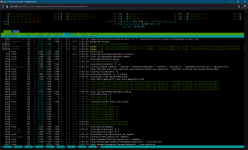
I'm not sure what this even is, as `top` doesn't show anything of significance. It's also not a graphical bug, as my wall outlet power measuring brick shows a significant increase in workload (60-70 idle, 80-90W normal load, 160W currently).

pve8to9 --full reads the following output;

root@pve1:~# pve8to9 --full
= CHECKING VERSION INFORMATION FOR PVE PACKAGES =

Checking for package updates..
PASS: all packages up-to-date

Checking proxmox-ve package version..
PASS: already upgraded to Proxmox VE 9

Checking running kernel version..
PASS: running new kernel '6.14.11-4-pve' after upgrade.

= CHECKING CLUSTER HEALTH/SETTINGS =

SKIP: standalone node.

= CHECKING HYPER-CONVERGED CEPH STATUS =

SKIP: no hyper-converged ceph setup detected!

= CHECKING CONFIGURED STORAGES =

PASS: storage 'local' enabled and active.
PASS: storage 'local-zfs' enabled and active.
PASS: storage 'tank' enabled and active.
INFO: Checking storage content type configuration..
PASS: no storage content problems found
PASS: no storage re-uses a directory for multiple content types.
INFO: Check for usage of native GlusterFS storage plugin...
PASS: No GlusterFS storage found.
INFO: Checking whether all external RBD storages have the 'keyring' option configured
SKIP: No RBD storage configured.

= VIRTUAL GUEST CHECKS =

SKIP: Skipping check for running guests - already upgraded.
INFO: Checking if LXCFS is running with FUSE3 library, if already upgraded..
PASS: systems seems to be upgraded and LXCFS is running with FUSE 3 library
INFO: Checking for VirtIO devices that would change their MTU...
PASS: All guest config descriptions fit in the new limit of 8 KiB
INFO: Checking container configs for deprecated lxc.cgroup entries
WARN: The following CTs have 'lxc.cgroup' keys configured, which will be ignored in the new default unified cgroupv2:
CT 102, CT 107
Often it can be enough to change to the new 'lxc.cgroup2' prefix after the upgrade to Proxmox VE 7.x
INFO: Checking VM configurations for outdated machine versions
PASS: All VM machine versions are recent enough

= MISCELLANEOUS CHECKS =

INFO: Checking common daemon services..
PASS: systemd unit 'pveproxy.service' is in state 'active'
PASS: systemd unit 'pvedaemon.service' is in state 'active'
PASS: systemd unit 'pvescheduler.service' is in state 'active'
PASS: systemd unit 'pvestatd.service' is in state 'active'
INFO: Checking for supported & active NTP service..
PASS: Detected active time synchronisation unit 'chrony.service'
INFO: Checking if the local node's hostname 'pve1' is resolvable..
INFO: Checking if resolved IP is configured on local node..
PASS: Resolved node IP '192.168.1.3' configured and active on single interface.
INFO: Check node certificate's RSA key size
PASS: Certificate 'pve-root-ca.pem' passed Debian Busters (and newer) security level for TLS connections (4096 >= 2048)
PASS: Certificate 'pve-ssl.pem' passed Debian Busters (and newer) security level for TLS connections (2048 >= 2048)
PASS: Certificate 'pveproxy-ssl.pem' passed Debian Busters (and newer) security level for TLS connections (4096 >= 2048)
INFO: Checking backup retention settings..
PASS: no backup retention problems found.
INFO: checking CIFS credential location..
PASS: no CIFS credentials at outdated location found.
INFO: Checking permission system changes..
INFO: Checking custom role IDs
PASS: no custom roles defined
INFO: Checking node and guest description/note length..
PASS: All node config descriptions fit in the new limit of 64 KiB
INFO: Checking if the suite for the Debian security repository is correct..
PASS: found no suite mismatch
INFO: Checking for existence of NVIDIA vGPU Manager..
PASS: No NVIDIA vGPU Service found.
INFO: Checking bootloader configuration...
PASS: bootloader packages installed correctly
INFO: Check for dkms modules...
SKIP: could not get dkms status
INFO: Check for legacy 'filter' or 'group' sections in /etc/pve/notifications.cfg...
INFO: Check for legacy 'notification-policy' or 'notification-target' options in /etc/pve/jobs.cfg...
PASS: No legacy 'notification-policy' or 'notification-target' options found!
INFO: Check for LVM autoactivation settings on LVM and LVM-thin storages...
PASS: No problematic volumes found.
INFO: Checking lvm config for thin_check_options...
PASS: Check for correct thin_check_options passed
INFO: Check post RRD metrics data format migration situation...
PASS: No old RRD metric files found, normally this means all have been migrated.
INFO: Checking for IPAM DB files that have not yet been migrated.
PASS: No legacy IPAM DB found.
PASS: No legacy MAC DB found.
INFO: Checking if the legacy sysctl file '/etc/sysctl.conf' needs to be migrated to new '/etc/sysctl.d/' path.
PASS: Legacy file '/etc/sysctl.conf' is not present.
INFO: Checking if matching CPU microcode package is installed.
WARN: The matching CPU microcode package 'intel-microcode' could not be found! Consider installing it to receive the latest security and bug fixes for your CPU.
apt install intel-microcode

= SUMMARY =

TOTAL: 42
PASSED: 35
SKIPPED: 5
WARNINGS: 2
FAILURES: 0

I'm not sure where to go from here. It's not a time sensitive issue, but an additional 80W over a long period of time is a significant bump in electricity costs to me.

Thanks in advance.
 

Attachments

  • RXsEWrY.png
    RXsEWrY.png
    381.5 KB · Views: 14
  • imdDqCq.png
    imdDqCq.png
    399 KB · Views: 13
I read on the proxmox wiki that it didn't matter, I installed it just now just in case but the results seem to be the same.

INFO: Checking if the legacy sysctl file '/etc/sysctl.conf' needs to be migrated to new '/etc/sysctl.d/' path.
PASS: Legacy file '/etc/sysctl.conf' is not present.
INFO: Checking if matching CPU microcode package is installed.
PASS: Found matching CPU microcode package 'intel-microcode' installed.
= SUMMARY =
TOTAL: 42
PASSED: 36
SKIPPED: 5
WARNINGS: 1
FAILURES: 0
 
I tried running 6.8 I had installed from long before the upgrade, but it made no visible change. Any other ideas available?
 
I occasionally see a python3 and systemd process that take up 35% for one tick, but other than that there's nothing as far as i can see

Code:
top - 20:04:08 up 1 min,  1 user,  load average: 3.42, 1.02, 0.36
Threads: 536 total,   6 running, 530 sleeping,   0 stopped,   0 zombie
%Cpu(s): 33.4 us,  7.3 sy,  0.0 ni, 59.2 id,  0.0 wa,  0.0 hi,  0.0 si,  0.0 st
MiB Mem :  31963.0 total,  29494.6 free,   2584.8 used,    333.7 buff/cache     
MiB Swap:      0.0 total,      0.0 free,      0.0 used.  29378.1 avail Mem

    PID USER      PR  NI    VIRT    RES    SHR S  %CPU  %MEM     TIME+ COMMAND                                                                                                         
   1882 monitor+  20   0  375068   4996   1176 S   1.3   0.0   0:00.67 npcd                                                                                                           
   2229 root      20   0  177372 109212   5732 S   1.3   0.3   0:00.26 pvestatd                                                                                                       
   2163 root      20   0  176016 105840   3640 R   0.7   0.3   0:00.17 pve-firewall                                                                                                   
  33404 root      20   0   11160   4828   2524 R   0.7   0.0   0:00.11 top                                                                                                             
      1 root      20   0   24456  10800   6960 S   0.3   0.0   0:01.11 systemd                                                                                                         
    106 root      20   0       0      0      0 I   0.3   0.0   0:00.04 kworker/1:1-events                                                                                             
    127 root      20   0       0      0      0 I   0.3   0.0   0:00.02 kworker/u48:3-events_power_efficient                                                                           
   1462 root      20   0    8680   3176   1896 S   0.3   0.0   0:00.01 check_mk_agent                                                                                                 
   1835 root      20   0  461184  41848  36272 S   0.3   0.1   0:00.09 server                                                                                                         
   3218 www-data  20   0  232040 161304   8740 S   0.3   0.5   0:00.28 pveproxy worker                                                                                                 
   6029 100999    20   0   40108  33472   4632 S   0.3   0.1   0:00.19 database                                                                                                       
  47690 monitor+  20   0   10856   7028   3700 R   0.3   0.0   0:00.01 process_perfdat                                                                                                 
  47692 monitor+  20   0   10908   7000   3544 R   0.3   0.0   0:00.01 process_perfdat                                                                                                 
  47694 monitor+  20   0   10080   6264   3704 R   0.3   0.0   0:00.01 process_perfdat                                                                                                 
  47695 monitor+  20   0       0      0      0 R   0.3   0.0   0:00.01 process_perfdat                                                                                                 
      2 root      20   0       0      0      0 S   0.0   0.0   0:00.00 kthreadd                                                                                                       
      3 root      20   0       0      0      0 S   0.0   0.0   0:00.00 pool_workqueue_release                                                                                         
      4 root       0 -20       0      0      0 I   0.0   0.0   0:00.00 kworker/R-rcu_gp                                                                                               
      5 root       0 -20       0      0      0 I   0.0   0.0   0:00.00 kworker/R-sync_wq                                                                                               
      6 root       0 -20       0      0      0 I   0.0   0.0   0:00.00 kworker/R-kvfree_rcu_reclaim                                                                                   
      7 root       0 -20       0      0      0 I   0.0   0.0   0:00.00 kworker/R-slub_flushwq                                                                                         
      8 root       0 -20       0      0      0 I   0.0   0.0   0:00.00 kworker/R-netns                                                                                                 
      9 root      20   0       0      0      0 I   0.0   0.0   0:00.04 kworker/0:0-events                                                                                             
     10 root       0 -20       0      0      0 I   0.0   0.0   0:00.00 kworker/0:0H-events_highpri                                                                                     
     11 root      20   0       0      0      0 I   0.0   0.0   0:00.00 kworker/0:1
 
This is very strange.
To view the top 10 user processes with the highest CPU usage, please run the following command:
ps -e -o pid,user,pcpu,pmem,comm --sort=-pcpu | grep -v '\[' | head -n 11
 
Huh. So I killed two processes for testing purposes, but proxmox still shows 40% cpu usage.

Code:
root@pve1:~# ps -e -o pid,user,pcpu,pmem,comm --sort=-pcpu | grep -v '\[' | head -n 11
    PID USER     %CPU %MEM COMMAND
3454562 root      100  0.0 ps
   1882 monitor+  3.8  0.0 npcd
 256806 100000    3.6  4.2 jsvc
      1 root      1.6  0.0 systemd
3446150 root      1.0  0.0 systemd
1514552 root      0.8  0.0 napi/wg0-0
   2229 root      0.6  0.3 pvestatd
2364541 root      0.5  0.0 kworker/5:4-events
 258567 100000    0.3  0.3 mongod
 752502 root      0.3  0.0 kworker/5:0-wg-crypt-wg0
root@pve1:~# pkill 3454562
root@pve1:~# ps -e -o pid,user,pcpu,pmem,comm --sort=-pcpu | grep -v '\[' | head -n 11
    PID USER     %CPU %MEM COMMAND
3524940 monitor+  107  0.0 python3
   1882 monitor+  3.8  0.0 npcd
 256806 100000    3.5  4.2 jsvc
      1 root      1.6  0.0 systemd
1514552 root      0.7  0.0 napi/wg0-0
   2229 root      0.6  0.3 pvestatd
2364541 root      0.4  0.0 kworker/5:4-wg-crypt-wg0
 258567 100000    0.3  0.3 mongod
 752502 root      0.3  0.0 kworker/5:0-wg-crypt-wg0
1367521 root      0.3  0.0 kworker/5:2-events
root@pve1:~# pkill 3524940
root@pve1:~# ps -e -o pid,user,pcpu,pmem,comm --sort=-pcpu | grep -v '\[' | head -n 11
    PID USER     %CPU %MEM COMMAND
   1882 monitor+  3.8  0.0 npcd
 256806 100000    3.5  4.2 jsvc
      1 root      1.6  0.0 systemd
   2229 root      0.6  0.3 pvestatd
2364541 root      0.4  0.0 kworker/5:4-wg-crypt-wg0
 258567 100000    0.3  0.3 mongod
 752502 root      0.3  0.0 kworker/5:0-wg-crypt-wg0
1367521 root      0.3  0.0 kworker/5:2-events
3043010 root      0.2  0.0 kworker/5:1-events
   5594 100999    0.2  0.1 pihole-FTL
 
The top output shows the following:
  • User processes: 33.4% CPU usage
  • System/kernel processes: 7.3% CPU usage
High CPU usage by user processes may be caused by hidden processes, possibly due to rootkits or other malicious software.
To check for these processes, install and run the unhide package with the proc -v parameter.
The scan usually takes about one minute to complete.

Bash:
apt install unhide
unhide proc -v
 
It comes up fully emtpy.

Code:
root@pve1:~# unhide proc -v
Unhide 20240509
Copyright © 2010-2024 Yago Jesus & Patrick Gouin
License GPLv3+ : GNU GPL version 3 or later
http://www.unhide-forensics.info

NOTE : This version of unhide is for systems using Linux >= 2.6

Used options: verbose
[*]Searching for Hidden processes through /proc stat scanning

root@pve1:~#

I also tried rkhunter --check, which returned some false positives (i think)

Code:
    /usr/bin/kmod                                            [ OK ]
    /usr/bin/systemctl                                       [ OK ]
    /usr/bin/mawk                                            [ OK ]
    /usr/bin/lwp-request                                     [ Warning ]
    /usr/bin/bsd-mailx                                       [ OK ]
    /usr/bin/dash                                            [ OK ]
    /usr/bin/x86_64-linux-gnu-size                           [ OK ]
    /usr/bin/x86_64-linux-gnu-strings                        [ OK ]
    /usr/bin/inetutils-telnet                                [ OK ]
    /usr/bin/which.debianutils                               [ OK ]
    /usr/share/ifupdown2/__main__.py                         [ Warning ]
    /usr/lib/systemd/systemd                                 [ OK ]

chkrootkit had the following;
WARNING: Possible Linux BPFDoor Malware installed:
/proc/1446/stack
and the file itself:
Code:
[<0>] __skb_wait_for_more_packets+0x138/0x1a0
[<0>] __unix_dgram_recvmsg+0x115/0x5f0
[<0>] unix_seqpacket_recvmsg+0x43/0x70
[<0>] sock_recvmsg+0xde/0xf0
[<0>] ____sys_recvmsg+0xa1/0x230
[<0>] ___sys_recvmsg+0xc9/0xf0
[<0>] do_recvmmsg+0x126/0x340
[<0>] __x64_sys_recvmmsg+0xd2/0xf0
[<0>] x64_sys_call+0x1b82/0x2310
[<0>] do_syscall_64+0x7e/0x170
[<0>] entry_SYSCALL_64_after_hwframe+0x76/0x7e
 
Huh. I think this may have had to do with checkmk. They generated way too many logs, so I uninstalled the agent and the site, rebooted, and the problem went away.

I'm not tech savvy enough to diagnose this myself, but if anyone's interested hit me up. Thanks Juliokele!
 
  • Like
Reactions: juliokele