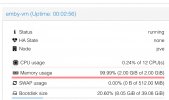
100% memory used after 7.0 upgrade

chudak

Well-Known Member
May 11, 2019
322
16
58
Hello all

I know it maybe unrelated, but I noticed this after upgrading to 7.0 pve.

I have a CT that is used only to run Emby server. It has 2GB RAM allocated. I’ve never seen memory use more then 1.2 GB and tested it to its limits on multiple steams etc before came to conclusion that 2GB is a good number.

After 7.0 I see 100% memory used on a single stream and it’s very odd. Tried to restore 3 weeks old backup and see no difference.

So wondering, maybe it’s related to the latest .0 upgrade, some changes how containers are managed ?
Anybody else has seen something similar?

Thx

PS: any clues how to troubleshoot/fix it
 

Attachments

  • 6B195939-2DF3-47B1-AD07-B2786040989E.jpeg
    6B195939-2DF3-47B1-AD07-B2786040989E.jpeg
    135.9 KB · Views: 20
Trying to reboot shows error

Code:
lxc-stop: 1000: commands_utils.c: lxc_cmd_sock_rcv_state: 51 Resource temporarily unavailable - Failed to receive message
 
It’s seems like a real problem in 7.0, I restored older versions of Emby and confirmed that they all behaving with the same problem.
Unless somebody has better idea I think that it’s related to the latest update and the way LXC memory is managed.

any comments?
 
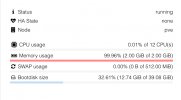
Compare what pve shows vs ‘free -m’
Maybe pve 7.0 incorrectly shows stats ? Or I miss interpreted this …

@t.lamprecht pls see ^
 

Attachments

  • 6EC2654B-16C4-4CCA-B44D-07F296AFAA54.jpeg
    6EC2654B-16C4-4CCA-B44D-07F296AFAA54.jpeg
    83.1 KB · Views: 11
  • 3EB21EF7-6BB6-4D40-8A03-E3079F7134CD.jpeg
    3EB21EF7-6BB6-4D40-8A03-E3079F7134CD.jpeg
    107.8 KB · Views: 11
Last edited:
Compare what pve shows vs ‘free -m’
Maybe pve 7.0 incorrectly shows stats ? Or I miss interpreted this …

@t.lamprecht pls see ^
Both show the same. "Available" memory is the same as "used" memory. So 2042MB are used and 6MB are free. And top/htop are counting "available" RAM as free RAM what is wrong.

Linux will eat all RAM you throw at it for caching. So its totally fine and normal if the RAM is always at 100% as long as most of the RAM is counted as "available".
 
Last edited:
Both show the same. "Available" memory is the same as "used" memory. So 2042MB are used and 6MB are free. And top/htop are counting "available" RAM as free RAM what is wrong.

Linux will eat all RAM you throw at it for caching. So its totally fine and normal if the RAM is always at 100% as long as most of the RAM is counted as "available".
It’s definitely was not like this before 7.0
It sounds you say it’s not a problem
Was anything that you know changed in 7.0 that would cause the difference I see ?
 
Full 2GB RAM is blocked by the LXC and can't be used by the host or other LXCs/VMs. But the LXC can always delete some of the cached stuff to free up some space if guest processes would need it.
So from the host point of view nearly 100% are used...because full 2GB of physical RAM are used by the VM. From the guests point of view only 10% are used and 90% available, because these 90% can be freed up easily within seconds.

So its no problem at all. Just monitor the "available" RAM using free -h inside the LXC. If there is always a bit RAM "available" its all fine.
 
Last edited:
Full 2GB RAM is blocked by the LXC and can't be used by the host or other LXCs/VMs. But the LXC can always delete some of the cached stuff to free up some space if guest processes would need it.
So from the host point of view nearly 100% are used...because full 2GB of physical RAM are used by the VM. From the guests point of view only 10% are used and 90% available, because these 90% can be freed up easily within seconds.

So its no problem at all. Just monitor the "available" RAM using free -h inside the LXC. If there is always a bit RAM "available" its all fine.

I understand what you say, but again its never been like this before 7.0, lxc never shown 100% memory being used
Thank you !
 
There were alot of big changes from 6.3 to 6.4/7.0. LXC updated to 4.0, kernel updated to 5.11, switch from cgroup1 to cgroup2 which changed SWAP handling. But that linux will eat all your RAM for caching isn't anything new. That is the normal case for decades.
Maybe caching is done a little bit more agressive now or something like that. But caching is a good thing to have. You don't want a OS to have unused RAM. Thats wasted potential. The more RAM is used for "cache/buffer" and the less RAM is "free" the faster your LXC will be.
This is only problematic if you are trying to overprovision the RAM, where VMs/LXCs need to fight who may use the same RAM.
 
Last edited:
There were alot of big changes from 6.3 to 6.4/7.0. LXC updated to 4.0, kernel updated to 5.11, switch from cgroup1 to cgroup2 which changed SWAP handling. But that linux will eat all your RAM for caching isn't anything new. That is the normal case for decades.
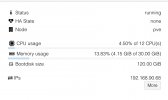
This is a different VM, but it does not show 100% use !
 

Attachments

  • F8D55139-DCB4-4B31-868F-E40FDBDC8D7D.jpeg
    F8D55139-DCB4-4B31-868F-E40FDBDC8D7D.jpeg
    84.8 KB · Views: 11
Do some reads/writes (for example write 50GB of files) and it will go up to nearly 100% too. If there is no disk access there is not much to cache.

Or is it a Windows VM? For Windows Proxmox is showing the RAM differently (RAM used for caching will be shown as "free" instead of "used". It will be most likely also be at 100% RAM usage because of caching but it won't show it in the graph).
 
Last edited:
Why is memory usage displayed in the container taking into account the buffer but not in the node itself?
Isn't it logical to make them at least the same if you really want to take into account the buffer?
 
  • Like
Reactions: chudak
Not a real issue with your container; just an issue with how PVE presents information which is inconsistent with what it was presenting before. The actual memory used and behavior has not changed. See https://forum.proxmox.com/threads/proxmox-ve-7-0-released.92007/page-6#post-402231

TL;DR: Nothing for you to do, for now you have to monitor your memory usage via `free -m` from inside CT until PVE fixes how the values are presented in dashboard by pvestatd.

This is a different VM, but it does not show 100% use !
VMs and CTs are inherently different and so will behave differently. The bug does not affect VMs, only CTs due to LXC 4.0 update.
 
Last edited:
Not a real issue with your container; just an issue with how PVE presents information which is inconsistent with what it was presenting before. The actual memory used and behavior has not changed. See https://forum.proxmox.com/threads/proxmox-ve-7-0-released.92007/page-6#post-402231

TL;DR: Nothing for you to do, for now you have to monitor your memory usage via `free -m` from inside CT until PVE fixes how the values are presented in dashboard by pvestatd.


VMs and CTs are inherently different and so will behave differently. The bug does not affect VMs, only CTs due to LXC 4.0 update.

Yes I completely agree after looking into this for awhile. It's a WebUI bug and I logged it.
Thanks for the update!
 

About

The Proxmox community has been around for many years and offers help and support for Proxmox VE, Proxmox Backup Server, and Proxmox Mail Gateway.
We think our community is one of the best thanks to people like you!

Get your subscription!

The Proxmox team works very hard to make sure you are running the best software and getting stable updates and security enhancements, as well as quick enterprise support. Tens of thousands of happy customers have a Proxmox subscription. Get yours easily in our online shop.

Buy now!