0 backup files 250GB+ HD is still taken ?!
- Thread starter chudak
- Start date
You are using an out of date browser. It may not display this or other websites correctly.
You should upgrade or use an alternative browser.
You should upgrade or use an alternative browser.
GC will only remove chunks once they are older than 24 hours. This has technical reasons, see the second note here: https://pbs.proxmox.com/docs/backup-client.html#garbage-collection
GC will only remove chunks once they are older than 24 hours. This has technical reasons, see the second note here: https://pbs.proxmox.com/docs/backup-client.html#garbage-collection
Thx @aaron
I kept pbs server with no backups and still see the space used

So quotations :
1 - will it be ever freed ?
2 - is it OK ?
3 - how to clean it up?
Thx
Last edited:
You can define schedules for prune and GC and verification jobs for each datastore. Be careful with verification schedules because they will need to read the whole datastore and thus will take quite some time.I see now.
Ran Prune & CC and now see the spaced free.
That's cool, but it's not automatic ?!
It is possible that the chunks were not older than 24 hours (see 2nd note https://pbs.proxmox.com/docs/backup-client.html#garbage-collection) or that they are used by other backups as well?
It is possible that the chunks were not older than 24 hours (see 2nd note https://pbs.proxmox.com/docs/backup-client.html#garbage-collection) or that they are used by other backups as well?
I am positive.
See this:

Initial backup was ~<200GB for 6-7 VMs
Yesterday 24+ h I removed all but one snapshot.

Ran GC
....
2021-02-17T09:32:33-08:00: Original data usage: 120.00 GiB
2021-02-17T09:32:33-08:00: On-Disk usage: 95.98 GiB (79.98%)
2021-02-17T09:32:33-08:00: On-Disk chunks: 30094
2021-02-17T09:32:33-08:00: Deduplication factor: 1.25
2021-02-17T09:32:33-08:00: Average chunk size: 3.27 MiB
2021-02-17T09:32:33-08:00: TASK OK
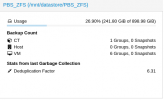
why does the graph show 300GB+ taken?
And the dashboard shows:

df -h => PBS_ZFS 899G 98G 802G 11% /mnt/datastore/PBS_ZFS
It seems that the top graph (datastore Summary) does not show the correct value.
Agree?
Last edited:
It does look a bit off, but two questions: What if you set the time interval for the graph to one hour? (top right)
Since this is a ZFS dataset, what is the output of
I don't see that effect in my personal productive PBS installation :/
Since this is a ZFS dataset, what is the output of
zfs list?I don't see that effect in my personal productive PBS installation :/
It does look a bit off, but two questions: What if you set the time interval for the graph to one hour? (top right)
Since this is a ZFS dataset, what is the output ofzfs list?
I don't see that effect in my personal productive PBS installation :/
What is interesting that the summary graph went down to 105.05GB but still not exact number as in the dashboard.
Is graph updates delayed?!
zfs list
NAME USED AVAIL REFER MOUNTPOINT
PBS_ZFS 272G 627G 272G /mnt/datastore/PBS_ZFS
(272G already after new backup ran, so the expected number was 98G)
And the interval was set for "monthly average".
This is how it looks today (again after one more backup was added):

Last edited:


