Hi,
At first thank You very much for any help that I could receive cause I'm completely new towards Proxmox VE world.
We bought server with those specs:
iDRAC picture with hardware set for RAID-10
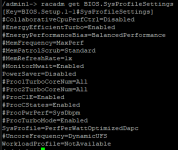
CPU configuration:
I have successfully migrated few Linux-VM from HyperV to Proxmox (had problems with old CentOS 5.9 VM with Asterisk and Elastix GUI for VoIP/PABX because of VHD file - but fortunately after many posts over here [many thanks] did it. Here already small question if for let's say Ubuntu where's WireGuard let's say those specs are properly set?
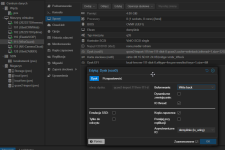
But to main topic, I'm having huge problems with IO Speed for DB Queries over two 2022 STD VM's and very sluggish RDP over them. What I did was:
- setting up VM with those values from picture so small description
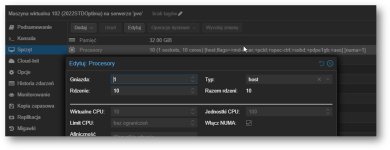
VM q35 9.2 / 32GB / 1s 10cores with NUMA enabled and cpu type: host option / UEFI / VirtIO-GPU / VirtIO SCS Single with values for scsiX as from picture below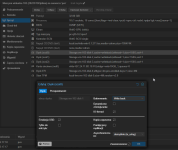
- installed virtio-win-0.1.271 package for both VM's
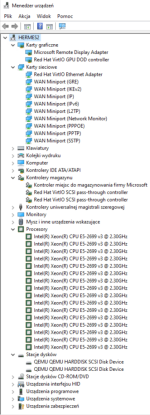
Did some tests with CrystalDiskMark, here "on paper" seems fine but probably it's mostly because of scsiX option for Write Back, correct?
On network transfer between two VM's tested with iperf3 and between proxmox VM and HyperV VM seems everything alright.
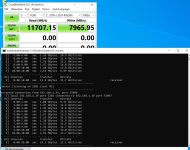
I tried multiple options over CPU/SCSI selection etc., I admit didn't try setting asynchronic IO threads instead of io_uring - question if this will work?
Tried two different virtio drivers (older ones just a bit), tried messing around with caching in scsiX drives, and still performance over IO is not good..
Over this example I have old workstation where this Proxmox machine was meant to swap it with other VM's but I tested IO over SQL and old specs. are dramatically better..
Specs here:
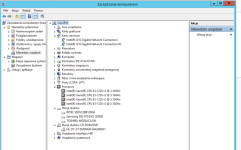
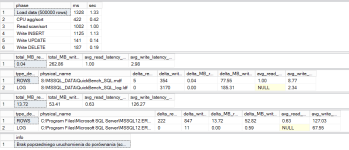
And here SQL queries perfom with testing from old machine:
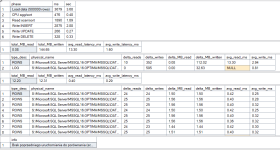
Here is info from new proxmox set machine.. When I saw this my knees collapsed..:
Apart from that I have huge RDP lag problems what I tried was:
- blocking via internal Firewall Remote Desktop UDP protocol,
- turning off option in gpedit.msc related to RDS Connection Client ("Turn off UDP on client")
- and in RDS Host for Connections setting up "Select RDP transport protocol" only for usage of TCP
And still after all of those things RDP is very unresponding.
Right now I'm on verge of crying cause we bought something and I'm no way near to seeing this as "better" option. It seems way slower.. Please help, I will try everything to make it better, since I already migrated this as working environment.
Thank You, with best regards,
Szymon.
Have a nice day/evening.
At first thank You very much for any help that I could receive cause I'm completely new towards Proxmox VE world.
We bought server with those specs:
Code:
DELL R730 8x2,5''
2x E5-2699 v3 18x 2.3GHz
128GB DDR4 ECC
H730P Mini SAS 12Gbit/s 2GB
RAID 10 (hardware set) over
 - 6x 3.84TB SAS SSD HGST/WD HUSTR7638ASS20X 12Gb
RAID 1 (hardware set) over
 - 2x Intel D3-S4510 480GB for virtualization purposes
Dell Intel X520-I350 2x 10Gbit SFP+ and 2x 1Gbit RJ45

RJ45 is for iDRAC, SFP+ plugged in to D-LINK DGS-1510-52X over fiber 2x DAC 10GbE
Server plugged in to UPS 3000VA (polish brand so I won't be advertising unneccesary :P)
iDRAC picture with hardware set for RAID-10

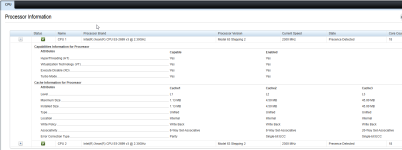
CPU configuration:

I have successfully migrated few Linux-VM from HyperV to Proxmox (had problems with old CentOS 5.9 VM with Asterisk and Elastix GUI for VoIP/PABX because of VHD file - but fortunately after many posts over here [many thanks] did it. Here already small question if for let's say Ubuntu where's WireGuard let's say those specs are properly set?

But to main topic, I'm having huge problems with IO Speed for DB Queries over two 2022 STD VM's and very sluggish RDP over them. What I did was:
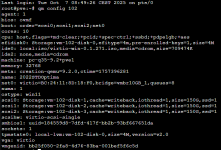
- setting up VM with those values from picture so small description
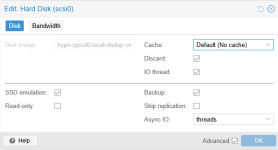
VM q35 9.2 / 32GB / 1s 10cores with NUMA enabled and cpu type: host option / UEFI / VirtIO-GPU / VirtIO SCS Single with values for scsiX as from picture below


- installed virtio-win-0.1.271 package for both VM's

Did some tests with CrystalDiskMark, here "on paper" seems fine but probably it's mostly because of scsiX option for Write Back, correct?
On network transfer between two VM's tested with iperf3 and between proxmox VM and HyperV VM seems everything alright.

I tried multiple options over CPU/SCSI selection etc., I admit didn't try setting asynchronic IO threads instead of io_uring - question if this will work?
Tried two different virtio drivers (older ones just a bit), tried messing around with caching in scsiX drives, and still performance over IO is not good..
Over this example I have old workstation where this Proxmox machine was meant to swap it with other VM's but I tested IO over SQL and old specs. are dramatically better..
Specs here:

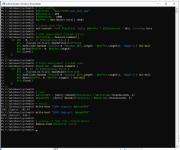
And here SQL queries perfom with testing from old machine:

Here is info from new proxmox set machine.. When I saw this my knees collapsed..:

Apart from that I have huge RDP lag problems what I tried was:
- blocking via internal Firewall Remote Desktop UDP protocol,
- turning off option in gpedit.msc related to RDS Connection Client ("Turn off UDP on client")
- and in RDS Host for Connections setting up "Select RDP transport protocol" only for usage of TCP
And still after all of those things RDP is very unresponding.
Right now I'm on verge of crying cause we bought something and I'm no way near to seeing this as "better" option. It seems way slower.. Please help, I will try everything to make it better, since I already migrated this as working environment.
Thank You, with best regards,
Szymon.
Have a nice day/evening.


