Proxmox 9.0.5 Ceph 19.2.3 Kubernetes ceph-csi-cephfs Hang

eyolfson

New Member
Aug 24, 2025
14
1
3
Hello there, apologies in advance if this is the wrong place but I'm at my wits end. This may require more real-time chatting. I've been trying to debug this for a month, going through all the documentation, changing hardware, and everything I can think of.

`ceph-csi-cephfs` seems to cause my system (running kernel `6.16.2`, `6.16.1`, `6.15.11`?, `6.12.43`) to freeze, or deadlock, causing the watchdog to force a reboot. It's a VM, the Ceph host is Proxmox running `6.14.8` kernel (and previous versions). This does not happen with a mounted cephfs volume on the host itself. This issue also happened with Ceph 19.2.2 and the latest Proxmox 8. `ceph-csi-cephfs` is installed using the Helm chart, currently at 3.15.0, but it happened with 3.14.x as well.

Currently Ceph is `19.2.3`, hardware is 3 nodes, each with: 9700X CPU, 3 osds (1 nvme Micron 7450 Pro with heatsink and no thermal issues, 2 hdd Seagate Exos), 64 GB RAM, 2x 10GbE ethernet ports, 1 for Proxmox 1 for Ceph storage. VMs each have a 2.5GbE NIC.

I cannot seem to trigger it consistently, but I have two pods mounting 2 static volumes (1 shared) using cephfs (backed by HDDs), and their own dynamic volumes on NVMes. My current workload has one pod adding files to the shared static volume, moving them to the other static volume. The node gets rebooted, and all of the ceph-csi-cephfs pods show exit code 255, with nothing in the logs.

I don't see anything on the host machine, the closest I see is `client.0 error registering admin socket command: (17) File exists` from the mgr around the time on one of the nodes, but that may just be the other pod picking it up (this seems to be an unrelated issue, everything runs fine, and manually stopping the mgr, deleting the socket file, and restarting it still has this error).

The only other thing I see in the osd logs is `osd.0 1541 mon_cmd_maybe_osd_create fail: 'osd.0 has already bound to class 'nvme', can not reset class to 'ssd'; use 'ceph osd crush rm-device-class <id>>`. I'm sure that's just a configuration option I just haven't seen yet, I picked nvme as the class when I created the OSD in the Proxmox UI.

I see nothing in the host indicating something went wrong, but my pods data gets corrupted (their own dynamic volume), and I have to start over again. I think I've removed any possible hardware issues, I bought a separate NIC for each VM and do PCI passthrough. There seems to be no packet loss.

If there's any tips anyone has to begin to figure this out, I would be very grateful, thanks! Because of the hard lock, I figure it must be the Ceph client in the kernel, but this is my first time using Ceph and I'm not sure how to go about debugging this, it isn't in the standard troubleshooting list.
 
Last edited:
Thanks for bringing this to our attention!

`ceph-csi-cephfs` seems to cause my system (running kernel `6.16.2`, `6.16.1`, `6.15.11`?, `6.12.43`) to freeze, or deadlock, causing the watchdog to force a reboot. It's a VM, the Ceph host is Proxmox running `6.14.8` kernel (and previous versions).

Just so I understand correctly, what "system" is freezing / deadlocking here exactly? Do you mean the VM?

If yes, which of the four kernel versions is the VM running now and which Linux distribution is it running in particular?
 
Yes, sorry, the system freezing is the VM, using ceph-csi-cephfs installed with the Helm chart.

Right now it's running ArchLinux, with the latest 6.16.3 now. The LTS kernel did it as well. I'm trying to reproduce it now without setting up a full workload, waiting for it to freeze, then having to restart again after it gets corrupted.
 
Hm, interesting. And it also kept freezing for versions 6.16.2, 6.16.1, 6.15.11, and 6.12.43?

Is there anything you're doing that's marked as alpha or beta in the Ceph CSI support matrix?

You might be able to find older logs via journalctl -b [N] -x, where [N] is the offset from the current boot. For example, journalctl -b -1 -x shows the logs of the last boot.
 
Yes, I had a hard lock for all of them.

Everything is GA in the matrix, I'm just doing a cephfs claim. Currently the Ceph CSI version is 3.15 with Kubernetes 1.33.

Thanks, I've looked at the old logs, and it shows nothing. journalctl -b -1 had nothing, it just all of a sudden reboots (I assume triggered by the watchdog). The QEMU process keeps alive, so Proxmox doesn't even update the uptime, it thinks its still running. There's no OOM or anything in the logs. There's no CPU/memory/IO pressure from what I can tell. I tried with and without memory ballooning just in case. The Ceph cluster itself stays at HEALTH_OK.
 
I think I found something else, the etcd election seems to be taking too long. It may be causing ceph-csi-cephfs to fail, bringing the kernel into uninterruptible sleep, forcing the watchdog reboot.

I'm triggering a movement of the etcd leader manually using etcdctl and I see this in my log: k3s[667]: {"level":"warn","ts":"2025-08-25T22:35:03.417118Z","caller":"v3rpc/interceptor.go:197","msg":"request stats","start time":"2025-08-25T22:35:02.916835Z","time spent":"500.27881ms","remote":"10.0.50.100:46774","response type":"/etcdserverpb.Maintenance/MoveLeader","request count":-1,"request size":-1,"response count":-1,"response size":-1,"request content":""}.

It seems that this should be well under 50 ms. I've checked latency using ping (<1 ms), iperf3 between all nodes (0 retries), and fio using fsync (~5 ms). It must be something with a real workload using disk, network, and CPU all at once?

The hardware on each node is: AMD 9700X 8 core CPU, 64 GB RAM, 500 GB Crucial T500 NVMe (Proxmox boot), 960 GB Micron 7450 Pro (NVMe OSD), 20 TB Seagate Exos x2 (2 HDD OSDs), 10 GbE Onboard x2 (one is dedicated to Ceph), 2.5 GbE NIC.

I've tried hosting the VMs on a Ceph pool backed by NVMe, and local-lvm, neither seems to change anything. I've also tried a virtual bridge with the 10 GbE (non-Ceph), and 2.5 GbE, both seem to have retries with iperf3. Currently, the 2.5 GbE NIC is using PCI passthrough.

Is there something I'm missing with the configuration? Do I need to try pinning CPUs as well? There seems to be some IO delay, but not that much (are the HDDs causing a backlog?) Any insights to poor etcd performance would be welcome!
 
Hmm, interesting.

I've tried hosting the VMs on a Ceph pool backed by NVMe, and local-lvm, neither seems to change anything.

Just so I'm understanding correctly: The Ceph pool here was backed solely by your NVMe drives? Assuming your local-lvm storage is on your Crucial T500. If freezes still happen, then I doubt it's related to the drives.

I've also tried a virtual bridge with the 10 GbE (non-Ceph), and 2.5 GbE, both seem to have retries with iperf3.

Weird that they're getting retries here though. What kind of hardware do you have in between? If you've got a switch or a router between your nodes, make sure it's not overheating or something. (Yeah, that can actually happen, depending on the hardware, where it's placed etc.)

Looking at the etcd docs, there are a couple of tuning options available. You could try increasing the election timeout according to their docs. That might just be a band-aid on some underlying issue, though. Assuming that your cluster is running locally (and not across multiple sites), you really shouldn't be hitting such high RTTs.
 
Thanks for the follow up!

Yes, the Ceph pool has the following CRUSH rule:
Code:
rule replicated-nvme {
    id 1
    type replicated
    step take default class nvme
    step chooseleaf firstn 0 type host
    step emit
}

The Micron 7450 Pro drives are the OSDs, and only ones with the nvme class. Yes, local-lvm is on the Crucial T500. I have a UniFi Enterprise XG 24. Everything is connected to it, the router is a UniFi Dream Machine Special Edition.

It seems to be very reproducible now, if I trigger a move-leader using etcdctl it's 500 ms every time. This was sub 50 ms on a bunch of RPi4s I had.

I've tried the following:
- Disable C-states
- Disabling PCI ASPM
- Disabling SMT
- MTU 9000 and the default 1500

cyclictest shows some high (rare?) variability on some cores. fping has some jitter, for some reason, rtt of up to 2.9 ms. round-trip min/avg/max = 0.4/1.3/2.9 ms.

Currently there's no workload, I have an empty Kubernetes cluster setup with K3s (even with local-storage, servicelb, and traefik disabled). It shouldn't be taking that long, so I'm hesitant to increase the timeouts, instead of trying to fix the issue.
 
Okay, seems like you've already done a lot of troubleshooting.

Is there anything else suspicious in your etcd logs? You might want to try querying some of its monitoring-related endpoints if etcdctl doesn't yield anything substantial. (Note that i'm not very familiar with etcd.)

Since you're running the same CPU on all nodes, have you tried setting your VMs' CPUs to host already?

Are you running into any other IO timeouts anywhere? You did mention that iperf3 is running into some retries.
 
Nothing in the logs, etcdctl check perf --load="m" passes. I think that just tests the individual node though, not the cluster networking? Here: https://github.com/etcd-io/etcd/blob/main/etcdctl/README.md it says that's good for 200 clients (there's 3). Monitoring isn't enabled by default, I'm not sure if it breaks down the requests to show which part is slow. Testing with fio and iperf3 both seem good.

Yes, sorry, all VM CPUs are host.

iperf3 was running into retries using the Linux virtual bridge, but I assumed that was Broadcom drivers. It seems to happen with a Linux virtual bridge with the Intel NICs as well, turning off tso seemed to help a bit. I just used PCI Passthrough instead to eliminate that.
 
Hmm, okay. I'm slowly reaching my wits' end here, then. You've tried to troubleshoot as much as possible already, and your configuration and your hardware otherwise seem sound, too.

The only other thing that you could perhaps do is gather tcpdumps and analyze them with Wireshark. See if you can spot the traffic generated by etcd and see how it behaves.

etcd appears to be using Raft for its consensus algorithm (as mentioned in their README). With just three nodes, that really shouldn't be taking long.
 
Last edited:
Thanks, I've been at this for what seems like a month now :( At least I have it down to a quick test, but it's still puzzling to me that it consistently takes 500 ms. Just in case there was CPU overcommitment, the VM is now just using 4 of the 8 physical cores.

The only other think I can think of is that the HDDs are causing a lot of interrupt traffic, or slowing down the overall IO queues? This is a fresh install of Proxmox 9.0.5, I just set up all the OSDs using the Proxmox UI.

Yes, I see some Raft slow operations during normal cluster operation too. I don't have the logs anymore since I tore it down and built it back up recently, but it was some operation that should take 100 ms, taking 140 ms.

It shouldn't matter much if the VMs are using the Ceph RBD pool backed by NVMe drives, or local-lvm backed by a normal consumer NVMe, correct? At least not on an order of 10x difference.
 
The only other think I can think of is that the HDDs are causing a lot of interrupt traffic, or slowing down the overall IO queues? This is a fresh install of Proxmox 9.0.5, I just set up all the OSDs using the Proxmox UI.

I mean, you normally shouldn't really mix HDDs and SSDs / NVMes in a Ceph cluster, so one thing you could try doing is removing the HDD OSDs one-by-one: First out, then destroy the OSD and let the cluster rebalance / heal itself in between; can be done on the GUI. Then see if the problem persists. Only then you can try tuning your cluster with CRUSH rules and assign each pool its own rule.

Otherwise, the IO scheduling shouldn't really matter unless the scheduler's overhead is actually starting to cut into your drives' performance. Only in very rare scenarios would you have to change a disk's IO scheduler, but if you're curious, here's how you can view which one's enabled for a given device:

Bash:
cat /sys/block/nvme0n1/queue/scheduler

Replace nvme0n1 with other devices you want to check, naturally.

The scheduler can be changed via a simple echo with the scheduler you want to use. For example, here I set the scheduler for my local NVMe to none, meaning that there's no IO scheduler active:

Bash:
echo 'none' > /sys/block/nvme0n1/queue/scheduler

You usually only need to do this if you have a bunch of powerful NVMes and you actually have evidence that the scheduler is cutting into your performance. Otherwise you might run into severe IO problems (usually with HDDs as they kind of rely on scheduling to have less seek time AFAIK; less so with NVMe drives).

Yes, I see some Raft slow operations during normal cluster operation too. I don't have the logs anymore since I tore it down and built it back up recently, but it was some operation that should take 100 ms, taking 140 ms.

Hm, even 100ms seems high. For the record, the PVE cluster stack requires a reliable network with latencies < 5ms.

It shouldn't matter much if the VMs are using the Ceph RBD pool backed by NVMe drives, or local-lvm backed by a normal consumer NVMe, correct? At least not on an order of 10x difference.

No, it shouldn't make that of a difference, unless you manage to fill the NVMe's internal cache and its performance starts to tank, but even when that happens it's usually not that big of a deal. You'd only run into this during sustained loads.

What you can otherwise do is benchmark the performance of your cluster in general; there are a bunch of resources out there that should help you. Just make sure you're running your benchmarks on a separate pool—you can try creating a brand new pool with the default replicated_rule CRUSH rule and another one with your custom rule, for example, and then run benchmarks on each.

I'm very curious to see how it all goes. It's often issues like these where you learn the most.
 
I mean, you normally shouldn't really mix HDDs and SSDs / NVMes in a Ceph cluster, so one thing you could try doing is removing the HDD OSDs one-by-one: First out, then destroy the OSD and let the cluster rebalance / heal itself in between; can be done on the GUI. Then see if the problem persists. Only then you can try tuning your cluster with CRUSH rules and assign each pool its own rule.

Sorry, I have separate pools for NVMe and HDDs, none of them are in the same pool. I have two CRUSH rules: replicated-nvme and erasure-hdd. Only my alternative CephFS data pool is erasure-hdd.

Otherwise, the IO scheduling shouldn't really matter unless the scheduler's overhead is actually starting to cut into your drives' performance. Only in very rare scenarios would you have to change a disk's IO scheduler, but if you're curious, here's how you can view which one's enabled for a given device:

Bash:
cat /sys/block/nvme0n1/queue/scheduler

Replace nvme0n1 with other devices you want to check, naturally.

The scheduler can be changed via a simple echo with the scheduler you want to use. For example, here I set the scheduler for my local NVMe to none, meaning that there's no IO scheduler active:

Bash:
echo 'none' > /sys/block/nvme0n1/queue/scheduler

You usually only need to do this if you have a bunch of powerful NVMes and you actually have evidence that the scheduler is cutting into your performance. Otherwise you might run into severe IO problems (usually with HDDs as they kind of rely on scheduling to have less seek time AFAIK; less so with NVMe drives).

This NVMe drives are none, and the HDDs are mq-deadline.

Hm, even 100ms seems high. For the record, the PVE cluster stack requires a reliable network with latencies < 5ms.


No, it shouldn't make that of a difference, unless you manage to fill the NVMe's internal cache and its performance starts to tank, but even when that happens it's usually not that big of a deal. You'd only run into this during sustained loads.

What you can otherwise do is benchmark the performance of your cluster in general; there are a bunch of resources out there that should help you. Just make sure you're running your benchmarks on a separate pool—you can try creating a brand new pool with the default replicated_rule CRUSH rule and another one with your custom rule, for example, and then run benchmarks on each.

I'm curious if this is needed if I'm not using the default replicated_rule for anything?

I'm very curious to see how it all goes. It's often issues like these where you learn the most.

Hopefully it can get resolved! This one is really testing me. I'm starting to think the 500 ms I'm seeing is built in, so maybe it's not a good test. However, I still see the >100 ms warning during real operation. I just can't get it to trigger reliably.
 
Sorry, I have separate pools for NVMe and HDDs, none of them are in the same pool. I have two CRUSH rules: replicated-nvme and erasure-hdd. Only my alternative CephFS data pool is erasure-hdd.

Oh, okay! My bad. That should be fine then.

.. and just to be sure, you're not seeing any performance cuts on the pool with the replicated-nvme rule, right?

I'm curious if this is needed if I'm not using the default replicated_rule for anything?

Well, benchmarking your cluster / pools could potentially reveal bottlenecks.

Hopefully it can get resolved! This one is really testing me. I'm starting to think the 500 ms I'm seeing is built in, so maybe it's not a good test. However, I still see the >100 ms warning during real operation. I just can't get it to trigger reliably.

Okay, I see. That's really interesting. Is the >100ms warning from ectd's healthcheck? Because that shouldn't take that long, from what I understand.

If you spot such a warning again, see if you can correlate it with the network traffic / IO pressure stall in the GUI.
 
Thanks again, much appreciated!

Oh, okay! My bad. That should be fine then.

.. and just to be sure, you're not seeing any performance cuts on the pool with the replicated-nvme rule, right?


Well, benchmarking your cluster / pools could potentially reveal bottlenecks.

Nope, seems fine, I previously did the benchmark on the replicated-nvme on the previous PVE8 and the performance seemed really good.

Okay, I see. That's really interesting. Is the >100ms warning from ectd's healthcheck? Because that shouldn't take that long, from what I understand.

If you spot such a warning again, see if you can correlate it with the network traffic / IO pressure stall in the GUI.

I don't see anything in the GUI, CPU usage "spiked" from 2% to 4%.

I just tried reinstalling some manifests to see how long it would take since there'd be some real etcd traffic. The common entry is:

Code:
Aug 26 16:05:09 node-1 k3s[566]: {"level":"warn","ts":"2025-08-26T16:05:09.913878Z","caller":"etcdserver/util.go:170","msg":"apply request took too long","took":"184.959414ms","expected-duration":"100ms","prefix":"","request":"header:<ID:15005880600711953541 username:\"etcd-client\" auth_revision:1 > txn:<compare:<target:MOD key:\"/registry/leases/kube-system/k3s\" mod_revision:721805 > success:<request_put:<key:\"/registry/leases/kube-system/k3s\" value_size:387 >> failure:<request_range:<key:\"/registry/leases/kube-system/k3s\" > >>","response":"size:18"}
Aug 26 16:05:10 node-1 k3s[566]: {"level":"warn","ts":"2025-08-26T16:05:10.286182Z","caller":"etcdserver/util.go:170","msg":"apply request took too long","took":"240.760048ms","expected-duration":"100ms","prefix":"read-only range ","request":"key:\"/registry/apiregistration.k8s.io/apiservices/\" range_end:\"/registry/apiregistration.k8s.io/apiservices0\" count_only:true ","response":"range_response_count:0 size:8"}

Code:
Aug 26 16:05:11 node-2 k3s[561]: {"level":"warn","ts":"2025-08-26T16:05:11.219455Z","caller":"etcdserver/util.go:170","msg":"apply request took too long","took":"822.019236ms","expected-duration":"100ms","prefix":"read-only range ","request":"key:\"/registry/leases/kube-system/k3s\" limit:1 ","response":"range_response_count:1 size:446"}
Aug 26 16:05:11 node-2 k3s[561]: {"level":"warn","ts":"2025-08-26T16:05:11.219525Z","caller":"v3rpc/interceptor.go:197","msg":"request stats","start time":"2025-08-26T16:05:10.397422Z","time spent":"822.098625ms","remote":"127.0.0.1:55102","response type":"/etcdserverpb.KV/Range","request count":0,"request size":36,"response count":1,"response size":469,"request content":"key:\"/registry/leases/kube-system/k3s\" limit:1 "}
Aug 26 16:05:11 node-2 k3s[561]: {"level":"warn","ts":"2025-08-26T16:05:11.219453Z","caller":"etcdserver/util.go:170","msg":"apply request took too long","took":"592.660483ms","expected-duration":"100ms","prefix":"read-only range ","request":"key:\"/registry/csinodes/\" range_end:\"/registry/csinodes0\" count_only:true ","response":"range_response_count:0 size:8"}
Aug 26 16:05:11 node-2 k3s[561]: {"level":"warn","ts":"2025-08-26T16:05:11.219561Z","caller":"v3rpc/interceptor.go:197","msg":"request stats","start time":"2025-08-26T16:05:10.626773Z","time spent":"592.785776ms","remote":"127.0.0.1:55274","response type":"/etcdserverpb.KV/Range","request count":0,"request size":44,"response count":3,"response size":31,"request content":"key:\"/registry/csinodes/\" range_end:\"/registry/csinodes0\" count_only:true "}

Code:
Aug 26 16:05:11 node-3 k3s[581]: {"level":"warn","ts":"2025-08-26T16:05:11.236479Z","caller":"etcdserver/util.go:170","msg":"apply request took too long","took":"863.258622ms","expected-duration":"100ms","prefix":"read-only range ","request":"key:\"/registry/leases/kube-system/k3s-cloud-controller-manager\" limit:1 ","response":"range_response_count:1 size:507"}
Aug 26 16:05:11 node-3 k3s[581]: {"level":"warn","ts":"2025-08-26T16:05:11.236515Z","caller":"v3rpc/interceptor.go:197","msg":"request stats","start time":"2025-08-26T16:05:10.857919Z","time spent":"378.591812ms","remote":"127.0.0.1:49632","response type":"/etcdserverpb.Maintenance/Status","request count":-1,"request size":-1,"response count":-1,"response size":-1,"request content":""}
Aug 26 16:05:11 node-3 k3s[581]: {"level":"warn","ts":"2025-08-26T16:05:11.236538Z","caller":"v3rpc/interceptor.go:197","msg":"request stats","start time":"2025-08-26T16:05:10.373208Z","time spent":"863.32687ms","remote":"127.0.0.1:49928","response type":"/etcdserverpb.KV/Range","request count":0,"request size":61,"response count":1,"response size":530,"request content":"key:\"/registry/leases/kube-system/k3s-cloud-controller-manager\" limit:1 "}
Aug 26 16:05:11 node-3 k3s[581]: {"level":"warn","ts":"2025-08-26T16:05:11.236475Z","caller":"etcdserver/util.go:170","msg":"apply request took too long","took":"146.405314ms","expected-duration":"100ms","prefix":"read-only range ","request":"key:\"/registry/leases/kube-system/k3s-etcd\" limit:1 ","response":"range_response_count:1 size:563"}
Aug 26 16:05:11 node-3 k3s[581]: {"level":"warn","ts":"2025-08-26T16:05:11.236562Z","caller":"etcdserver/util.go:170","msg":"apply request took too long","took":"251.985163ms","expected-duration":"100ms","prefix":"read-only range ","request":"key:\"/registry/leases/kube-system/kube-scheduler\" limit:1 ","response":"range_response_count:1 size:479"}
Aug 26 16:05:11 node-3 k3s[581]: {"level":"warn","ts":"2025-08-26T16:05:11.236496Z","caller":"etcdserver/util.go:170","msg":"apply request took too long","took":"769.906952ms","expected-duration":"100ms","prefix":"read-only range ","request":"key:\"/registry/leases/ceph-csi-cephfs/external-snapshotter-leader-cephfs-csi-ceph-com\" limit:1 ","response":"range_response_count:1 size:556"}
Aug 26 16:05:11 node-3 k3s[581]: {"level":"warn","ts":"2025-08-26T16:05:11.236581Z","caller":"v3rpc/interceptor.go:197","msg":"request stats","start time":"2025-08-26T16:05:10.466578Z","time spent":"770.00157ms","remote":"127.0.0.1:49928","response type":"/etcdserverpb.KV/Range","request count":0,"request size":84,"response count":1,"response size":579,"request content":"key:\"/registry/leases/ceph-csi-cephfs/external-snapshotter-leader-cephfs-csi-ceph-com\" limit:1 "}

I see some new records of over 800 ms.
 
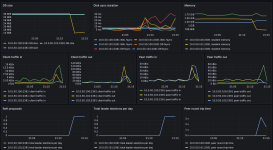
I got the metrics exported, I believe the election was from the reboot, so maybe its unrelated? As soon as the first election happened the disk sync time shot up (local-lvm for this run). I managed to get iostat running for a few ticks as it was about to reboot:

Code:
avg-cpu:  %user   %nice %system %iowait  %steal   %idle
           3.64    0.00   13.32   22.74    0.25   60.05

Device            r/s     rkB/s   rrqm/s  %rrqm r_await rareq-sz     w/s     wkB/s   wrqm/s  %wrqm w_await wareq-sz     d/s     dkB/s   drqm/s  %drqm d_await dareq-sz     f/s f_await  aqu-sz  %util
sda              3.50    322.00     0.00   0.00    0.86    92.00  600.50 258736.00     5.50   0.91    1.75   430.87    0.00      0.00     0.00   0.00    0.00     0.00   22.00    0.75    1.07   4.75
sr0              0.00      0.00     0.00   0.00    0.00     0.00    0.00      0.00     0.00   0.00    0.00     0.00    0.00      0.00     0.00   0.00    0.00     0.00    0.00    0.00    0.00   0.00


avg-cpu:  %user   %nice %system %iowait  %steal   %idle
           4.93    0.00   13.91   20.23    0.13   60.81

Device            r/s     rkB/s   rrqm/s  %rrqm r_await rareq-sz     w/s     wkB/s   wrqm/s  %wrqm w_await wareq-sz     d/s     dkB/s   drqm/s  %drqm d_await dareq-sz     f/s f_await  aqu-sz  %util
sda              2.00      8.00     0.00   0.00    2.25     4.00   45.50    456.00     2.50   5.21    0.27    10.02    0.00      0.00     0.00   0.00    0.00     0.00   12.00    0.46    0.02   1.35
sr0              0.00      0.00     0.00   0.00    0.00     0.00    0.00      0.00     0.00   0.00    0.00     0.00    0.00      0.00     0.00   0.00    0.00     0.00    0.00    0.00    0.00   0.00

I haven't had to go over these numbers before, but it seems mostly idle. Any insight would be appreciated.

Is there anyway to see what causes the watchdog to reboot the system?
 

Attachments

  • Screenshot 2025-08-26 at 17.15.31.png
    Screenshot 2025-08-26 at 17.15.31.png
    480.2 KB · Views: 7
Last edited:
From everything you sent, one thing stands out on that screenshot you attached: The Peer RTT (bottom right) for your third node spikes up to over 3 seconds all of a sudden, correlating with the increase in traffic and the Raft proposal.

Additionally, from the stats you sent, there's an %iowait at around 20-22% — this means that 20-22% of your CPUs' time is spent waiting for disk IO (see man 1 iostat). There seems to be quite some traffic on /dev/sda in the first result, 258736.00 wkB/s, so 258736 kilobytes / second or ~252 megabytes / second. Was this with just etcd running, or were you running anything else at that time?

So if I understand correctly, /dev/sda is now on local-lvm, and local-lvm is the storage on top of your consumer NVMe. Since there's quite some %iowait, the NVMe might actually not be able to handle the writes from your VM. What just occurred to me: It could be that etcd is issusing a lot of sync writes, especially during leader election, which means that the writes will (should) bypass the NVMe's cache. So that could very well be the reason why things start to hang.

To elaborate a little further, the same most likely applies when your VM is on top of a Ceph pool backed by your NVMes: Ceph will only acknowledge writes to a client if the data was fully replicated, and that of course also applies to sync writes. So even if one replica is slow, the whole write operation is slow.

Does the same occur when you only use your enterprise NVMes? As in, if you configure them as lvm-thin type storage on all of your nodes (you can then migrate the existing VM disks on local-lvm over to your new LVM thin storage in the VM hardware config). I realize that this means that you unfortunately might have to tear down Ceph or one of your pools to test that. :S

I suspect that the consumer NVMes might very well be the culprit here, at least if your VMs are on top of the local-lvm storage. Are those NVMes also part of your Ceph cluster?

Is there anyway to see what causes the watchdog to reboot the system?

Assuming you're running the regular watchdog in your VM, that should be in /var/log/watchdog. Otherwise, you might want to check the config at /etc/watchdog.conf or /etc/watchdog.d. (See the manpage here).
 
  • Like
Reactions: UdoB
No idea what it was, I think it's fixed now, I think it was some mysterious VLAN issue? I tore down everything, used kubeadm to create a new cluster, and choose cilium. The connectivity test failed one test with "VLAN traffic disallowed by VLAN filter", which is odd since I just had it on a native VLAN, and it was only one specific test with massive packet loss. I set up the VM to be VLAN aware itself, and included the VLAN in the cilium configuration. The connectivity test passed, and it seems to be good now. Thanks for all the help!

I guess there was just one path that didn't have VLAN tags stripped by the time they hit the VM, or something, and they got dropped. It probably had something to do with the Ceph path, since it caused a watchdog timeout and a hard reboot.

[EDIT] No, never mind, still broken.
 
Last edited:
Also, sorry, to follow up, local-lvm is that much slower? I didn't have issues running etcd on Raspberry Pi 4s, or that much worse for sync? I tried with write back cache too, unless I need to go to write back (unsafe).

EDIT: etcd seems to be fine now. The only time I had slow operations is when one node got forcefully rebooted.

Hmm, I don't seem to have those in my VM for the watchdog. I do have this though:
Code:
wdctl
Device:        /dev/watchdog0
Identity:      iTCO_wdt [version 2]
Timeout:       30 seconds
Timeleft:      600 seconds
FLAG           DESCRIPTION               STATUS BOOT-STATUS
KEEPALIVEPING  Keep alive ping reply          0           0
MAGICCLOSE     Supports magic close char      0           0
SETTIMEOUT     Set timeout (in seconds)       0           0

Although, that seems very long. I don't think it even waits that long, it just reboots. I'm not sure if my kernel is just rebooting because of a panic (I've set kernel.panic to 0, so I don't think so). I'm not sure what else would cause my machine to silently reboot.
 
Last edited: