Default Read and encode all files into a single archive, using the pxar format version 1. Data Read and encode all files, but split data and metadata into separate streams, using the pxar format version 2.


Does changing "CT Change Detection Mode" from default to data speed up GC?
- Thread starter windowsdesxtop
- Start date
You are using an out of date browser. It may not display this or other websites correctly.
You should upgrade or use an alternative browser.
You should upgrade or use an alternative browser.
I'm asking because backups on zfs hdd are so slow (compared to ext4). zfs datastore gets like 1iops(while disk is like 100iops) while ext is closer to 1:1

I don't think this affects GC times. If you want faster backups try the metadata mode. If you want faster GCs we need to look at your pool and your settings.
Let's start with
Let's start with
Bash:
lsblk -o+FSTYPE,LABEL,MODEL
zpool status -vtLP
zfs get all pool/datasetofpbsShare the data and how you retrieved it.1iops(while disk is like 100iops

@Impact thank you.
I have two drastically different examples but I'm going with easiest one:
Raid1 x2 disks used only for pbs datastore (not for main pool). Attached to pbs lxc as mountpoint
"Share the data and how you retrieved it."
Example I'm running GC job notice how slow first part
Inside datastore graph below we can see like ~1IOPS
However in iostat -mx 1
Disk is doing about 100iops

I have two drastically different examples but I'm going with easiest one:
Raid1 x2 disks used only for pbs datastore (not for main pool). Attached to pbs lxc as mountpoint
NAME MAJ:MIN RM SIZE RO TYPE MOUNTPOINTS FSTYPE LABEL MODEL
sdb 8:16 0 7.3T 0 disk WDC WD8002FZBX-00C9HA0
├─sdb1 8:17 0 7.3T 0 part zfs_member d10
└─sdb9 8:25 0 8M 0 part
sdc 8:32 0 7.3T 0 disk WDC WD8002FZBX-00C9HA0
├─sdc1 8:33 0 7.3T 0 part zfs_member d10
└─sdc9 8:41 0 8M 0 part
zpool status -vtLP
pool: d10
state: ONLINE
scan: scrub repaired 0B in 15:16:29 with 0 errors on Sun Aug 9 15:40:30 2026
config:
NAME STATE READ WRITE CKSUM
d10 ONLINE 0 0 0
mirror-0 ONLINE 0 0 0
/dev/sdc1 ONLINE 0 0 0 (trim unsupported)
/dev/sdb1 ONLINE 0 0 0 (trim unsupported)
errors: No known data errors
zfs get all d10/subvol-100-disk-0
NAME PROPERTY VALUE SOURCE
d10/subvol-100-disk-0 type filesystem -
d10/subvol-100-disk-0 creation Tue Aug 4 17:33 2026 -
d10/subvol-100-disk-0 used 3.92T -
d10/subvol-100-disk-0 available 2.40T -
d10/subvol-100-disk-0 referenced 3.92T -
d10/subvol-100-disk-0 compressratio 1.00x -
d10/subvol-100-disk-0 mounted yes -
d10/subvol-100-disk-0 quota none default
d10/subvol-100-disk-0 reservation none default
d10/subvol-100-disk-0 recordsize 1M local
d10/subvol-100-disk-0 mountpoint /d10/subvol-100-disk-0 default
d10/subvol-100-disk-0 sharenfs off default
d10/subvol-100-disk-0 checksum on default
d10/subvol-100-disk-0 compression off inherited from d10
d10/subvol-100-disk-0 atime on default
d10/subvol-100-disk-0 devices on default
d10/subvol-100-disk-0 exec on default
d10/subvol-100-disk-0 setuid on default
d10/subvol-100-disk-0 readonly off default
d10/subvol-100-disk-0 zoned off default
d10/subvol-100-disk-0 snapdir hidden default
d10/subvol-100-disk-0 aclmode discard default
d10/subvol-100-disk-0 aclinherit restricted default
d10/subvol-100-disk-0 createtxg 39 -
d10/subvol-100-disk-0 canmount on default
d10/subvol-100-disk-0 xattr sa local
d10/subvol-100-disk-0 copies 1 default
d10/subvol-100-disk-0 version 5 -
d10/subvol-100-disk-0 utf8only off -
d10/subvol-100-disk-0 normalization none -
d10/subvol-100-disk-0 casesensitivity sensitive -
d10/subvol-100-disk-0 vscan off default
d10/subvol-100-disk-0 nbmand off default
d10/subvol-100-disk-0 sharesmb off default
d10/subvol-100-disk-0 refquota 6.84T local
d10/subvol-100-disk-0 refreservation none default
d10/subvol-100-disk-0 guid 11268682601373518823 -
d10/subvol-100-disk-0 primarycache all default
d10/subvol-100-disk-0 secondarycache all default
d10/subvol-100-disk-0 usedbysnapshots 0B -
d10/subvol-100-disk-0 usedbydataset 3.92T -
d10/subvol-100-disk-0 usedbychildren 0B -
d10/subvol-100-disk-0 usedbyrefreservation 0B -
d10/subvol-100-disk-0 logbias latency default
d10/subvol-100-disk-0 objsetid 387 -
d10/subvol-100-disk-0 dedup off default
d10/subvol-100-disk-0 mlslabel none default
d10/subvol-100-disk-0 sync standard default
d10/subvol-100-disk-0 dnodesize legacy default
d10/subvol-100-disk-0 refcompressratio 1.00x -
d10/subvol-100-disk-0 written 3.92T -
d10/subvol-100-disk-0 logicalused 3.91T -
d10/subvol-100-disk-0 logicalreferenced 3.91T -
d10/subvol-100-disk-0 volmode default default
d10/subvol-100-disk-0 filesystem_limit none default
d10/subvol-100-disk-0 snapshot_limit none default
d10/subvol-100-disk-0 filesystem_count none default
d10/subvol-100-disk-0 snapshot_count none default
d10/subvol-100-disk-0 snapdev hidden default
d10/subvol-100-disk-0 acltype posix local
d10/subvol-100-disk-0 context none default
d10/subvol-100-disk-0 fscontext none default
d10/subvol-100-disk-0 defcontext none default
d10/subvol-100-disk-0 rootcontext none default
d10/subvol-100-disk-0 relatime on default
d10/subvol-100-disk-0 redundant_metadata all default
d10/subvol-100-disk-0 overlay on default
d10/subvol-100-disk-0 encryption off default
d10/subvol-100-disk-0 keylocation none default
d10/subvol-100-disk-0 keyformat none default
d10/subvol-100-disk-0 pbkdf2iters 0 default
d10/subvol-100-disk-0 special_small_blocks 0 default
d10/subvol-100-disk-0 prefetch all default
d10/subvol-100-disk-0 direct standard default
d10/subvol-100-disk-0 longname off default
d10/subvol-100-disk-0 defaultuserquota 0 -
d10/subvol-100-disk-0 defaultgroupquota 0 -
d10/subvol-100-disk-0 defaultprojectquota 0 -
d10/subvol-100-disk-0 defaultuserobjquota 0 -
d10/subvol-100-disk-0 defaultgroupobjquota 0 -
d10/subvol-100-disk-0 defaultprojectobjquota 0 -
"Share the data and how you retrieved it."
Example I'm running GC job notice how slow first part
2026-08-10T00:00:01+03:00: Access time update check successful, proceeding with GC.
2026-08-10T00:00:01+03:00: Using access time cutoff 1d 5m, minimum access time is 2026-08-08T20:55:00Z
2026-08-10T00:00:01+03:00: Using chunk digest cache capacity of 8048576.
2026-08-10T00:00:01+03:00: Start GC phase1 (mark used chunks)
2026-08-10T00:00:51+03:00: marked 1% (7 of 603 index files)
2026-08-10T00:02:17+03:00: marked 2% (13 of 603 index files)
2026-08-10T00:02:47+03:00: marked 3% (19 of 603 index files)
2026-08-10T00:03:28+03:00: marked 4% (25 of 603 index files)
2026-08-10T00:04:07+03:00: marked 5% (31 of 603 index files)
2026-08-10T00:04:25+03:00: marked 6% (37 of 603 index files)
2026-08-10T00:05:39+03:00: marked 7% (43 of 603 index files)
2026-08-10T00:06:07+03:00: marked 8% (49 of 603 index files)
2026-08-10T00:07:53+03:00: marked 9% (55 of 603 index files)
2026-08-10T00:08:41+03:00: marked 10% (61 of 603 index files)
2026-08-10T00:09:52+03:00: marked 11% (67 of 603 index files)
2026-08-10T00:10:10+03:00: marked 12% (73 of 603 index files)
2026-08-10T00:14:23+03:00: marked 13% (79 of 603 index files)
2026-08-10T00:14:46+03:00: marked 14% (85 of 603 index files)
2026-08-10T00:15:16+03:00: marked 15% (91 of 603 index files)
2026-08-10T00:15:48+03:00: marked 16% (97 of 603 index files)
2026-08-10T00:15:56+03:00: marked 17% (103 of 603 index files)
2026-08-10T00:15:58+03:00: marked 18% (109 of 603 index files)
2026-08-10T00:16:39+03:00: marked 19% (115 of 603 index files)
2026-08-10T00:16:52+03:00: marked 20% (121 of 603 index files)
2026-08-10T00:16:59+03:00: marked 21% (127 of 603 index files)
2026-08-10T00:17:02+03:00: marked 22% (133 of 603 index files)
2026-08-10T00:17:04+03:00: marked 23% (139 of 603 index files)
2026-08-10T00:17:06+03:00: marked 24% (145 of 603 index files)
2026-08-10T00:17:09+03:00: marked 25% (151 of 603 index files)
2026-08-10T00:17:25+03:00: marked 26% (157 of 603 index files)
2026-08-10T00:17:26+03:00: marked 27% (163 of 603 index files)
2026-08-10T00:17:27+03:00: marked 28% (169 of 603 index files)
2026-08-10T00:17:31+03:00: marked 29% (175 of 603 index files)
2026-08-10T00:17:33+03:00: marked 30% (181 of 603 index files)
2026-08-10T00:17:38+03:00: marked 31% (187 of 603 index files)
2026-08-10T00:17:39+03:00: marked 32% (193 of 603 index files)
2026-08-10T00:17:42+03:00: marked 33% (199 of 603 index files)
2026-08-10T00:17:43+03:00: marked 34% (206 of 603 index files)
2026-08-10T00:17:44+03:00: marked 35% (212 of 603 index files)
2026-08-10T00:17:45+03:00: marked 36% (218 of 603 index files)
2026-08-10T00:17:45+03:00: marked 37% (224 of 603 index files)
2026-08-10T00:17:46+03:00: marked 38% (230 of 603 index files)
2026-08-10T00:17:47+03:00: marked 39% (236 of 603 index files)
2026-08-10T00:17:48+03:00: marked 40% (242 of 603 index files)
2026-08-10T00:17:49+03:00: marked 41% (248 of 603 index files)
2026-08-10T00:17:49+03:00: marked 42% (254 of 603 index files)
2026-08-10T00:17:50+03:00: marked 43% (260 of 603 index files)
2026-08-10T00:17:51+03:00: marked 44% (266 of 603 index files)
2026-08-10T00:17:51+03:00: marked 45% (272 of 603 index files)
2026-08-10T00:17:52+03:00: marked 46% (278 of 603 index files)
2026-08-10T00:17:53+03:00: marked 47% (284 of 603 index files)
2026-08-10T00:17:54+03:00: marked 48% (290 of 603 index files)
2026-08-10T00:17:56+03:00: marked 49% (296 of 603 index files)
2026-08-10T00:17:56+03:00: marked 50% (302 of 603 index files)
2026-08-10T00:17:57+03:00: marked 51% (308 of 603 index files)
2026-08-10T00:17:59+03:00: marked 52% (314 of 603 index files)
2026-08-10T00:18:02+03:00: marked 53% (320 of 603 index files)
2026-08-10T00:18:02+03:00: marked 54% (326 of 603 index files)
2026-08-10T00:18:03+03:00: marked 55% (332 of 603 index files)
2026-08-10T00:18:03+03:00: marked 56% (338 of 603 index files)
2026-08-10T00:18:05+03:00: marked 57% (344 of 603 index files)
2026-08-10T00:18:06+03:00: marked 58% (350 of 603 index files)
2026-08-10T00:18:06+03:00: marked 59% (356 of 603 index files)
2026-08-10T00:18:07+03:00: marked 60% (362 of 603 index files)
2026-08-10T00:18:07+03:00: marked 61% (368 of 603 index files)
2026-08-10T00:18:08+03:00: marked 62% (374 of 603 index files)
2026-08-10T00:18:09+03:00: marked 63% (380 of 603 index files)
2026-08-10T00:18:10+03:00: marked 64% (386 of 603 index files)
2026-08-10T00:18:10+03:00: marked 65% (392 of 603 index files)
2026-08-10T00:18:12+03:00: marked 66% (398 of 603 index files)
2026-08-10T00:18:14+03:00: marked 67% (405 of 603 index files)
2026-08-10T00:18:15+03:00: marked 68% (411 of 603 index files)
2026-08-10T00:18:16+03:00: marked 69% (417 of 603 index files)
2026-08-10T00:18:23+03:00: marked 70% (423 of 603 index files)
2026-08-10T00:18:24+03:00: marked 71% (429 of 603 index files)
2026-08-10T00:18:24+03:00: marked 72% (435 of 603 index files)
2026-08-10T00:18:25+03:00: marked 73% (441 of 603 index files)
2026-08-10T00:18:26+03:00: marked 74% (447 of 603 index files)
2026-08-10T00:18:27+03:00: marked 75% (453 of 603 index files)
2026-08-10T00:18:27+03:00: marked 76% (459 of 603 index files)
2026-08-10T00:18:27+03:00: marked 77% (465 of 603 index files)
2026-08-10T00:18:28+03:00: marked 78% (471 of 603 index files)
2026-08-10T00:18:30+03:00: marked 79% (477 of 603 index files)
2026-08-10T00:18:31+03:00: marked 80% (483 of 603 index files)
2026-08-10T00:18:31+03:00: marked 81% (489 of 603 index files)
2026-08-10T00:18:32+03:00: marked 82% (495 of 603 index files)
2026-08-10T00:18:40+03:00: marked 83% (501 of 603 index files)
2026-08-10T00:25:38+03:00: marked 84% (507 of 603 index files)
2026-08-10T00:32:01+03:00: marked 85% (513 of 603 index files)
2026-08-10T00:40:52+03:00: marked 86% (519 of 603 index files)
2026-08-10T00:42:41+03:00: marked 87% (525 of 603 index files)
2026-08-10T00:48:25+03:00: marked 88% (531 of 603 index files)
2026-08-10T00:49:18+03:00: marked 89% (537 of 603 index files)
2026-08-10T00:49:48+03:00: marked 90% (543 of 603 index files)
2026-08-10T00:50:00+03:00: marked 91% (549 of 603 index files)
2026-08-10T00:50:03+03:00: marked 92% (555 of 603 index files)
2026-08-10T00:50:17+03:00: marked 93% (561 of 603 index files)
2026-08-10T00:50:44+03:00: marked 94% (567 of 603 index files)
2026-08-10T00:50:51+03:00: marked 95% (573 of 603 index files)
2026-08-10T00:51:28+03:00: marked 96% (579 of 603 index files)
2026-08-10T00:51:29+03:00: marked 97% (585 of 603 index files)
2026-08-10T00:51:31+03:00: marked 98% (591 of 603 index files)
2026-08-10T00:57:48+03:00: marked 99% (597 of 603 index files)
2026-08-10T01:02:25+03:00: marked 100% (603 of 603 index files)
Inside datastore graph below we can see like ~1IOPS
However in iostat -mx 1
Disk is doing about 100iops
Last edited:
Is there a specific reason you disabled compression? AFAIK it will only help due to metadata compression, not hurt. Especially with HDDs. I'd try disabling
Is the HDD pool used for anything else? Maybe look at it more closely: https://gist.github.com/Impact123/3dbd7e0ddaf47c5539708a9cbcaab9e3#io-debugging
I'd also play around with the datastore's tuning options. GC Cache for example.
atime and enabling compression again. Ideally you set it at the pool root and let the CT's disk inherit it. Did you modify the PBS tuning options? What's zarcsummary -s arc on the node and cat /etc/proxmox-backup/datastore.cfg in the CT look like?Is the HDD pool used for anything else? Maybe look at it more closely: https://gist.github.com/Impact123/3dbd7e0ddaf47c5539708a9cbcaab9e3#io-debugging
I'd also play around with the datastore's tuning options. GC Cache for example.
Last edited:
@Impact thank you
> Is there a specific reason you disabled compression?
No reason at all. I will try enabling and rewriting data.
> I'd try disabling atime
Isn't that dangerous?
> Did you modify the PBS tuning options?
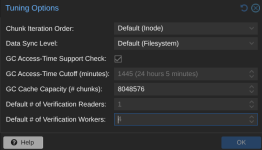
> What's zarcsummary -s arc on the node
P.S.
Here we can see that ZFS is reclaiming that cache too early. IMO it could keep it for longer. and maybe next day GC would have that data cached. as looks like second run is slightly faster (cached)
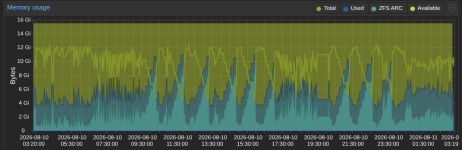
datastore: d10
comment
gc-schedule 00:00
notification-mode notification-system
path /mnt/d10
tuning gc-atime-safety-check=1,gc-cache-capacity=8048576
> Is the HDD pool used for anything else?
No. Only for PBS
> Is there a specific reason you disabled compression?
No reason at all. I will try enabling and rewriting data.
> I'd try disabling atime
Isn't that dangerous?
> Did you modify the PBS tuning options?
> What's zarcsummary -s arc on the node
zarcsummary -s arc
------------------------------------------------------------------------
ZFS Subsystem Report Tue Aug 11 03:18:16 2026
Linux 7.0.14-8-pve 2.4.3-pve1
Machine: dell (x86_64) 2.4.3-pve1
ARC status:
Total memory size: 15.5 GiB
Min target size: 3.1 % 495.5 MiB
Max target size: 82.0 % 12.7 GiB
Target size (adaptive): 16.0 % 2.1 GiB
Current size: 16.0 % 2.0 GiB
Free memory size: 9.0 GiB
Available memory size: 8.4 GiB
ARC structural breakdown (current size): 2.0 GiB
Compressed size: 53.5 % 1.1 GiB
Overhead size: 21.4 % 446.8 MiB
Bonus size: 4.4 % 92.6 MiB
Dnode size: 13.4 % 279.9 MiB
Dbuf size: 5.5 % 113.7 MiB
Header size: 1.6 % 34.2 MiB
L2 header size: 0.0 % 0 Bytes
ABD chunk waste size: < 0.1 % 1006.0 KiB
ARC types breakdown (compressed + overhead): 1.5 GiB
Data size: 29.9 % 466.8 MiB
Metadata size: 70.1 % 1.1 GiB
ARC states breakdown (compressed + overhead): 1.5 GiB
Anonymous data size: < 0.1 % 781.0 KiB
Anonymous metadata size: < 0.1 % 259.0 KiB
MFU data target: 10.6 % 165.7 MiB
MFU data size: 9.2 % 143.6 MiB
MFU evictable data size: 8.8 % 137.4 MiB
MFU ghost data size: 155.3 MiB
MFU metadata target: 58.6 % 914.6 MiB
MFU metadata size: 34.4 % 536.9 MiB
MFU evictable metadata size: 20.7 % 324.0 MiB
MFU ghost metadata size: 57.3 MiB
MRU data target: 1.2 % 19.1 MiB
MRU data size: 20.4 % 318.3 MiB
MRU evictable data size: 19.7 % 307.6 MiB
MRU ghost data size: 412.0 MiB
MRU metadata target: 29.6 % 462.4 MiB
MRU metadata size: 35.7 % 557.9 MiB
MRU evictable metadata size: 15.7 % 244.9 MiB
MRU ghost metadata size: 244.2 MiB
Uncached data size: 0.3 % 4.1 MiB
Uncached metadata size: 0.0 % 0 Bytes
ARC hash breakdown:
Elements: 146.5k
Collisions: 2.6M
Chain max: 5
Chains: 4.9k
ARC misc:
Uncompressed size: 589.0 % 6.4 GiB
Memory throttles: 0
Memory direct reclaims: 51281
Memory indirect reclaims: 2645187
Deleted: 21.4M
Mutex misses: 1.6k
Eviction skips: 362.3k
Eviction skips due to L2 writes: 0
L2 cached evictions: 0 Bytes
L2 eligible evictions: 2.0 TiB
L2 eligible MFU evictions: 12.1 % 246.3 GiB
L2 eligible MRU evictions: 87.9 % 1.7 TiB
L2 ineligible evictions: 165.2 GiB
P.S.
Here we can see that ZFS is reclaiming that cache too early. IMO it could keep it for longer. and maybe next day GC would have that data cached. as looks like second run is slightly faster (cached)
datastore: d10
comment
gc-schedule 00:00
notification-mode notification-system
path /mnt/d10
tuning gc-atime-safety-check=1,gc-cache-capacity=8048576
> Is the HDD pool used for anything else?
No. Only for PBS
You probably don't need to.and rewriting data.
Unlikely. It disables implicitIsn't that dangerous?
atime but tools can still explicitly set it on files. PBS should do this and it also has safety checks.You could try to set a higher minimum ARC size and also play around with metadata balance and other related properties like it. Try adding SWAP/ZRAM/ZSWAP and push "unused" memory to SWAP so that you have more for cache. That might backfire if not configured "properly" though. In my experience PBS itself doesn't need much memory. Do you know what causes the memory to increase and ARC to drop?ZFS is reclaiming that cache too early
I'd take a look at the various
zpool iostat commands from my link. Maybe some inefficiency sticks out.
Last edited:
> You could try to set a higher minimum ARC size
Don't want to speak too early but looks like this helped so much ..... Unbelievable
> Do you know what causes the memory to increase and ARC to drop?
Sounds like separate ZFS bug/tuning issue. Let's close this ticket.
Don't want to speak too early but looks like this helped so much
..... Unbelievable> Do you know what causes the memory to increase and ARC to drop?
Sounds like separate ZFS bug/tuning issue. Let's close this ticket.
Let me share my experience in this area.
I have 2 PBS servers both using HDD-s for datastore.
server 1 - I added MIRROR containing 2 SATA SSD to PBS datastore pool as special vdev. This improved GC performance like x20 (form 20 something hours to less than 1)
server 2 - PBS datastore is on RAIZD1, I have no possibility to add special vdev. In this case I made ARC tuning to ensure as much metadata as possible sits in RAM. In my case I adjusted parameters zfs_arc_meta_balance and zfs_arc_dnode_limit_percent. Such tuning gave me significant improvement in GC time. You need to prioritize metadata and dnode in ARC.
I have 2 PBS servers both using HDD-s for datastore.
server 1 - I added MIRROR containing 2 SATA SSD to PBS datastore pool as special vdev. This improved GC performance like x20 (form 20 something hours to less than 1)
server 2 - PBS datastore is on RAIZD1, I have no possibility to add special vdev. In this case I made ARC tuning to ensure as much metadata as possible sits in RAM. In my case I adjusted parameters zfs_arc_meta_balance and zfs_arc_dnode_limit_percent. Such tuning gave me significant improvement in GC time. You need to prioritize metadata and dnode in ARC.