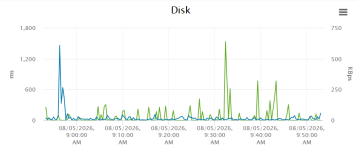
I am seeing sustained I/O Pressure and I/O Delay on one Proxmox node only when its VM disks are stored on NFS.
These are standalone nodes and are not in a cluster.
Node 1: Proxmox VE 9.2.2, kernel 7.0.2-6-pve, Dell PowerEdge R760, dual Xeon Gold 6426Y, 512 GB RAM, Intel E810 25 Gb NIC, 4 VMs.
Node 2: Proxmox VE 9.2.2, kernel 7.0.2-6-pve, Fujitsu RX2540, dual Xeon Silver 4410, 256 GB RAM, Intel X722 10 Gb NIC, 13 VMs.
Storage: Both nodes use the same TrueNAS H20 Enterprise NVMe storage, the same NFS export, NFS 4.2, and a dataset sync setting of standard.
All VMs use the same general configuration: qcow2 disks, VirtIO SCSI Single, I/O thread enabled, and the same Proxmox, kernel, QEMU, and NFS mount options.
All VMs on both nodes are running QEMU 11.0.0. Both nodes have the same relevant package versions:
proxmox-kernel-helper: 9.1.0+fde2
proxmox-kernel-7.0: 7.0.2-6
proxmox-kernel-7.0.2-6-pve-signed: 7.0.2-6
pve-qemu-kvm: 11.0.0-3
qemu-server: 9.1.15
The affected VMs have been fully stopped and started since the QEMU update, so they are not still running an older QEMU process.
On the Dell R760, I/O Pressure is typically sustained around 5–25%, with occasional higher spikes.
When the same VMs are moved from NFS to the Dell’s local NVMe ZFS storage, the pressure drops significantly.
The Dell originally used a Broadcom BCM57504 25 Gb NIC. I suspected the adapter, so I replaced it with an Intel E810 25 Gb NIC, but the behavior did not change.
The Fujitsu node uses the same TrueNAS server, NFS export, NFS 4.2 mount options, qcow2 format, VirtIO SCSI configuration, and software versions.
It has more active VMs and a 10 Gb connection, but it does not show the same sustained I/O Pressure.
I understand that network storage and file-backed virtual disks add latency compared with local block storage.
However, I have not found evidence of a performance bottleneck in the NFS or TrueNAS path.
During elevated pressure on the Dell, nfsiostat showed zero retransmissions, zero RPC backlog, zero errors, read and write RTT generally below 1 ms, and very low NFS queue time.
In one sample, the Dell exceeded 2,500 NFS write operations per second while write RTT remained around 0.4 ms.
The Intel E810 shows no meaningful CRC errors, drops, resets, link faults, or timeouts.
Per-VM PSI shows that several VMs are accumulating I/O pressure.
However, Windows PerfMon captures from the three main affected VMs showed typical write latency below 1 ms during active workloads, low disk queue depth, no sustained storage latency, no timeout or retry events, and no user-reported application problems.
Even during workloads exceeding 1,500–2,000 writes per second, guest-observed write latency remained around 0.5–1 ms.
QEMU block statistics confirmed that the affected workloads perform many small writes, generally around 5–6 KB each, but these are the same workloads that previously ran on local ZFS without elevated pressure.
The Dell is therefore recording real PSI I/O stalls when the VM disks are on NFS, but I have not found corresponding evidence that the TrueNAS storage, NFS connection, host, or guests are suffering from an actual performance problem.
NFS is clearly the condition that exposes the behavior, but the available measurements do not indicate that the NFS server or network path is slow or saturated.
The same storage and configuration also operate without sustained PSI on the Fujitsu node under a heavier VM load.
Has anyone seen one Proxmox host report significantly higher I/O PSI than another host using the same NFS storage?
Could this be related to QEMU, io_uring, NUMA placement, CPU scheduling, Linux PSI accounting, or something specific to the Dell R760 platform?
At this point, I suspect something host-specific on the Dell R760, but I have not been able to identify it.
Are there additional tracing or diagnostic tools that would show exactly which wait state PSI is accounting for?
These are standalone nodes and are not in a cluster.
Node 1: Proxmox VE 9.2.2, kernel 7.0.2-6-pve, Dell PowerEdge R760, dual Xeon Gold 6426Y, 512 GB RAM, Intel E810 25 Gb NIC, 4 VMs.
Node 2: Proxmox VE 9.2.2, kernel 7.0.2-6-pve, Fujitsu RX2540, dual Xeon Silver 4410, 256 GB RAM, Intel X722 10 Gb NIC, 13 VMs.
Storage: Both nodes use the same TrueNAS H20 Enterprise NVMe storage, the same NFS export, NFS 4.2, and a dataset sync setting of standard.
All VMs use the same general configuration: qcow2 disks, VirtIO SCSI Single, I/O thread enabled, and the same Proxmox, kernel, QEMU, and NFS mount options.
All VMs on both nodes are running QEMU 11.0.0. Both nodes have the same relevant package versions:
proxmox-kernel-helper: 9.1.0+fde2
proxmox-kernel-7.0: 7.0.2-6
proxmox-kernel-7.0.2-6-pve-signed: 7.0.2-6
pve-qemu-kvm: 11.0.0-3
qemu-server: 9.1.15
The affected VMs have been fully stopped and started since the QEMU update, so they are not still running an older QEMU process.
On the Dell R760, I/O Pressure is typically sustained around 5–25%, with occasional higher spikes.
When the same VMs are moved from NFS to the Dell’s local NVMe ZFS storage, the pressure drops significantly.
The Dell originally used a Broadcom BCM57504 25 Gb NIC. I suspected the adapter, so I replaced it with an Intel E810 25 Gb NIC, but the behavior did not change.
The Fujitsu node uses the same TrueNAS server, NFS export, NFS 4.2 mount options, qcow2 format, VirtIO SCSI configuration, and software versions.
It has more active VMs and a 10 Gb connection, but it does not show the same sustained I/O Pressure.
I understand that network storage and file-backed virtual disks add latency compared with local block storage.
However, I have not found evidence of a performance bottleneck in the NFS or TrueNAS path.
During elevated pressure on the Dell, nfsiostat showed zero retransmissions, zero RPC backlog, zero errors, read and write RTT generally below 1 ms, and very low NFS queue time.
In one sample, the Dell exceeded 2,500 NFS write operations per second while write RTT remained around 0.4 ms.
The Intel E810 shows no meaningful CRC errors, drops, resets, link faults, or timeouts.
Per-VM PSI shows that several VMs are accumulating I/O pressure.
However, Windows PerfMon captures from the three main affected VMs showed typical write latency below 1 ms during active workloads, low disk queue depth, no sustained storage latency, no timeout or retry events, and no user-reported application problems.
Even during workloads exceeding 1,500–2,000 writes per second, guest-observed write latency remained around 0.5–1 ms.
QEMU block statistics confirmed that the affected workloads perform many small writes, generally around 5–6 KB each, but these are the same workloads that previously ran on local ZFS without elevated pressure.
The Dell is therefore recording real PSI I/O stalls when the VM disks are on NFS, but I have not found corresponding evidence that the TrueNAS storage, NFS connection, host, or guests are suffering from an actual performance problem.
NFS is clearly the condition that exposes the behavior, but the available measurements do not indicate that the NFS server or network path is slow or saturated.
The same storage and configuration also operate without sustained PSI on the Fujitsu node under a heavier VM load.
Has anyone seen one Proxmox host report significantly higher I/O PSI than another host using the same NFS storage?
Could this be related to QEMU, io_uring, NUMA placement, CPU scheduling, Linux PSI accounting, or something specific to the Dell R760 platform?
At this point, I suspect something host-specific on the Dell R760, but I have not been able to identify it.
Are there additional tracing or diagnostic tools that would show exactly which wait state PSI is accounting for?