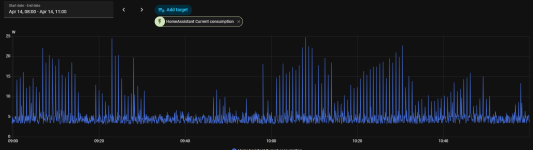
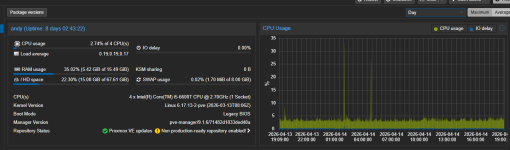
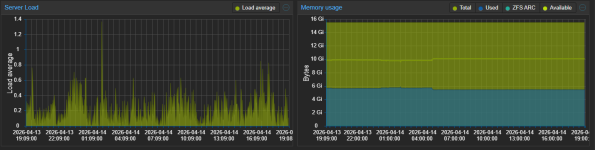
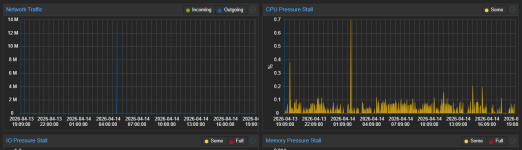
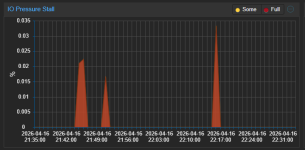
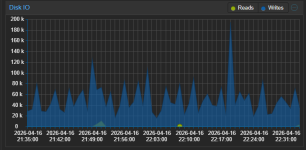
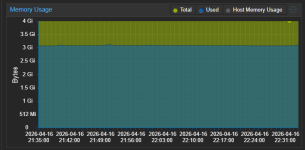
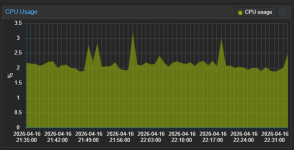
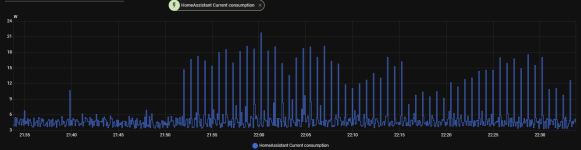
Hello, can you post your VM(s) or Host proxmox dashboard usage graphs please
The peaks you see in the graphs at 1 AM and 5 AM are VM backup and then backup inside HA to Google Drive.
Firstly I don't believe this is unusual.
Secondly, you seem to infer this is a PVE/host issue. I believe it is more likely the VM (Home Assistant) activity that is causing this. Home Assistant usage can be very varied (I've used it for years & constantly monitored its' temps & power draw). It gets up to all sorts of tasks & shenanigans depending on your specific setup. Its hard to compare 2 instances of HA apple for apple, since no 2 instances will be alike, but I also notice spikes from time to time, on a daily basis. I created an hourly average sensor to better monitor the situation for CPU temps, & it is pretty stable except when doing any updates/upgrades. You could create one for power draw and monitor that. Also, try looking at HA activity/history/logs for those spike periods.
If you really want to test - shutdown that VM & monitor the pure (hourly/daily?) PVE/host power draw. (Maybe difficult as it appears you are using HA to monitor this, also you may have a blackout without HA up & running!).
As far as I remember I did move HA to another PVE and shutdown it on the actual host. The consumption was the same (minus a few 0.5W for HA running).
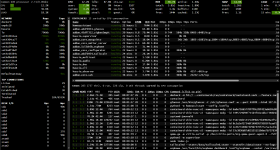
Run something like this and check what triggers the elevated load
If it occurs too infrequently to monitor live like this you need something like netdata.
top - 19:13:36 up 8 days, 2:48, 2 users, load average: 0.40, 0.26, 0.20
Tasks: 195 total, 1 running, 194 sleeping, 0 stopped, 0 zombie
%Cpu(s): 1.4 us, 2.4 sy, 0.0 ni, 96.2 id, 0.0 wa, 0.0 hi, 0.0 si, 0.0 st
MiB Mem : 15858.3 total, 739.4 free, 5594.0 used, 9916.8 buff/cache
MiB Swap: 8192.0 total, 8190.3 free, 1.7 used. 10264.2 avail Mem
PID USER PR NI VIRT RES SHR S %CPU %MEM TIME+ COMMAND
4712 root 20 0 5025.8m 3.8g 12.3m S 5.6 24.5 15,35 /usr/bin/kvm -id 100 -name haos17.1,debug-threads=on -no-shutdown -chardev socket,id=qmp,path+
722 root 20 0 1387.5m 109.6m 24.5m S 1.3 0.7 38:40.53 /usr/sbin/tailscaled --state=/var/lib/tailscale/tailscaled.state --socket=/run/tailscale/tail+
3071522 www-data 20 0 230.5m 164.4m 13.3m S 0.7 1.0 0:05.17 pveproxy worker
3084789 www-data 20 0 229.1m 159.9m 10.5m S 0.7 1.0 0:03.36 pveproxy worker
3109691 root 20 0 6.9m 3.4m 3.1m S 0.7 0.0 0:00.52 bash -c while true; do sleep 1;head -v -n 8 /proc/meminfo; head -v -n 2 /proc/stat /proc/vers+
782 _chrony 20 0 19.5m 3.6m 2.8m S 0.3 0.0 0:01.32 /usr/sbin/chronyd -F 1
3006239 root 20 0 222.8m 153.1m 8.8m S 0.3 1.0 0:09.04 pvedaemon worker
3109723 root 20 0 10.2m 6.0m 3.8m R 0.3 0.0 0:00.66 top -em -co%CPU
1 root 20 0 24.0m 14.8m 10.4m S 0.0 0.1 25:56.26 /sbin/init
2 root 20 0 0.0m 0.0m 0.0m S 0.0 0.0 0:01.33 [kthreadd]
3 root 20 0 0.0m 0.0m 0.0m S 0.0 0.0 0:00.00 [pool_workqueue_release]
4 root 0 -20 0.0m 0.0m 0.0m I 0.0 0.0 0:00.00 [kworker/R-rcu_gp]
5 root 0 -20 0.0m 0.0m 0.0m I 0.0 0.0 0:00.00 [kworker/R-sync_wq]
6 root 0 -20 0.0m 0.0m 0.0m I 0.0 0.0 0:00.00 [kworker/R-kvfree_rcu_reclaim]
7 root 0 -20 0.0m 0.0m 0.0m I 0.0 0.0 0:00.00 [kworker/R-slub_flushwq]
8 root 0 -20 0.0m 0.0m 0.0m I 0.0 0.0 0:00.00 [kworker/R-netns]
10 root 0 -20 0.0m 0.0m 0.0m I 0.0 0.0 0:00.00 [kworker/0:0H-events_highpri]
13 root 0 -20 0.0m 0.0m 0.0m I 0.0 0.0 0:00.00 [kworker/R-mm_percpu_wq]
14 root 20 0 0.0m 0.0m 0.0m S 0.0 0.0 0:13.69 [ksoftirqd/0]
15 root 20 0 0.0m 0.0m 0.0m I 0.0 0.0 3:42.83 [rcu_preempt]
16 root 20 0 0.0m 0.0m 0.0m S 0.0 0.0 0:00.00 [rcu_exp_par_gp_kthread_worker/0]
17 root 20 0 0.0m 0.0m 0.0m S 0.0 0.0 0:00.39 [rcu_exp_gp_kthread_worker]
18 root rt 0 0.0m 0.0m 0.0m S 0.0 0.0 0:03.82 [migration/0]
19 root -51 0 0.0m 0.0m 0.0m S 0.0 0.0 0:00.00 [idle_inject/0]
20 root 20 0 0.0m 0.0m 0.0m S 0.0 0.0 0:00.00 [cpuhp/0]
21 root 20 0 0.0m 0.0m 0.0m S 0.0 0.0 0:00.00 [cpuhp/1]
22 root -51 0 0.0m 0.0m 0.0m S 0.0 0.0 0:00.00 [idle_inject/1]
23 root rt 0 0.0m 0.0m 0.0m S 0.0 0.0 0:03.90 [migration/1]
24 root 20 0 0.0m 0.0m 0.0m S 0.0 0.0 0:09.40 [ksoftirqd/1]
26 root 0 -20 0.0m 0.0m 0.0m I 0.0 0.0 0:00.00 [kworker/1:0H-events_highpri]
27 root 20 0 0.0m 0.0m 0.0m S 0.0 0.0 0:00.00 [cpuhp/2]
28 root -51 0 0.0m 0.0m 0.0m S 0.0 0.0 0:00.00 [idle_inject/2]
29 root rt 0 0.0m 0.0m 0.0m S 0.0 0.0 0:03.82 [migration/2]
30 root 20 0 0.0m 0.0m 0.0m S 0.0 0.0 0:09.20 [ksoftirqd/2]
32 root 0 -20 0.0m 0.0m 0.0m I 0.0 0.0 0:00.00 [kworker/2:0H-events_highpri]
33 root 20 0 0.0m 0.0m 0.0m S 0.0 0.0 0:00.00 [cpuhp/3]
34 root -51 0 0.0m 0.0m 0.0m S 0.0 0.0 0:00.00 [idle_inject/3]
35 root rt 0 0.0m 0.0m 0.0m S 0.0 0.0 0:03.80 [migration/3]
Idk if I'm pasting the right thing.