Random IO Error - Windows Server 2025

dcuadrados

New Member
Aug 10, 2025
7
2
3
Hello everyone,

I'm experiencing a random "IO Error" that causes my two Windows Server 2025 Data Center VMs to randomly halt (yellow triangle in Proxmox). A reset/reboot resolves the issue temporarily.

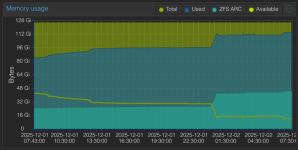
My environment details are below. I suspect a potential conflict with my configuration, possibly related to I/O or the high RAM usage.


Node and Storage

Node: Proxmox VE 9.0.11 on Linux 6.14 kernel.
CPU: Intel Xeon E-2288G (16C).
RAM Usage: High (approx. 89% of 31 GiB).
Storage: ZFS pool built on two 960 GB Samsung NVMe SSDs (S.M.A.R.T. OK, low wearout).
Repo Status: Non production-ready repository enabled.


Windows VM Configuration

Both Windows Server 2025 VMs use the following critical settings:

Setting Value
SCSI Controller VirtIO SCSI single
Disk Image RAW format on ZFS
I/O Settings aio=io_uring, cache=writeback, discard=on, iothread=1, ssd=1
Memory 13 GiB and 6 GiB respectively
Processors Host CPU type
BIOS OVMF (UEFI)

Has anyone encountered this specific IO Error with this configuration (especially VirtIO/ZFS/IO_URING) on recent Proxmox versions?

My apologies, I accidentally posted this twice
 
Last edited:
Hi,
please check the host system logs/journal for any messages around the time of the issue. What does zpool status -v say?

What does the following output when the VM is in IO error state, replacing 123 with the actual ID:
Code:
echo '{"execute": "qmp_capabilities"}{"execute": "query-block"}' | socat - /run/qemu-server/123.qmp
?
 
  • Like
Reactions: dcuadrados
Hi,
please check the host system logs/journal for any messages around the time of the issue. What does zpool status -v say?

What does the following output when the VM is in IO error state, replacing 123 with the actual ID:
Code:
echo '{"execute": "qmp_capabilities"}{"execute": "query-block"}' | socat - /run/qemu-server/123.qmp
?
Right now there’s no IO Error; if it happens again, I’ll do it again. Anyway, I’ve already downgraded the driver to VirtIO version 0.1.271.


Code:
{"QMP": {"version": {"qemu": {"micro": 2, "minor": 1, "major": 10}, "package": "pve-qemu-kvm_10.1.2-1"}, "capabilities": []}}
{"return": {}}
{"return": [{"device": "", "locked": false, "removable": false, "inserted": {"iops_rd": 0, "detect_zeroes": "off", "active": true, "image": {"virtual-size": 3653632, "filename": "/usr/share/pve-edk2-firmware//OVMF_CODE_4M.secboot.fd", "format": "raw", "actual-size": 3653632, "dirty-flag": false}, "iops_wr": 0, "ro": true, "children": [{"node-name": "#block013", "child": "file"}], "node-name": "pflash0", "backing_file_depth": 0, "drv": "raw", "iops": 0, "bps_wr": 0, "write_threshold": 0, "encrypted": false, "bps": 0, "bps_rd": 0, "cache": {"no-flush": false, "direct": false, "writeback": true}, "file": "/usr/share/pve-edk2-firmware//OVMF_CODE_4M.secboot.fd"}, "qdev": "/machine/system.flash0", "type": "unknown"}, {"device": "", "locked": false, "removable": false, "inserted": {"iops_rd": 0, "detect_zeroes": "on", "active": true, "image": {"backing-image": {"virtual-size": 540672, "filename": "json:{\"driver\": \"raw\", \"size\": 540672, \"file\": {\"driver\": \"file\", \"filename\": \"/var/lib/vz/images/100102/vm-100102-disk-0.raw\"}}", "format": "raw", "actual-size": 664064, "dirty-flag": false}, "virtual-size": 540672, "filename": "json:{\"throttle-group\": \"throttle-drive-efidisk0\", \"driver\": \"throttle\", \"file\": {\"driver\": \"raw\", \"size\": 540672, \"file\": {\"driver\": \"file\", \"filename\": \"/var/lib/vz/images/100102/vm-100102-disk-0.raw\"}}}", "format": "throttle", "actual-size": 664064, "dirty-flag": false}, "iops_wr": 0, "ro": false, "children": [{"node-name": "f41fd0da37cb0538e56f7d2c231d098", "child": "file"}], "node-name": "drive-efidisk0", "backing_file_depth": 1, "drv": "throttle", "iops": 0, "bps_wr": 0, "write_threshold": 0, "encrypted": false, "bps": 0, "bps_rd": 0, "cache": {"no-flush": false, "direct": false, "writeback": true}, "file": "json:{\"throttle-group\": \"throttle-drive-efidisk0\", \"driver\": \"throttle\", \"file\": {\"driver\": \"raw\", \"size\": 540672, \"file\": {\"driver\": \"file\", \"filename\": \"/var/lib/vz/images/100102/vm-100102-disk-0.raw\"}}}"}, "qdev": "/machine/system.flash1", "type": "unknown"}, {"io-status": "ok", "device": "", "locked": false, "removable": true, "qdev": "ide2", "tray_open": true, "type": "unknown"}, {"io-status": "ok", "device": "", "locked": false, "removable": false, "inserted": {"iops_rd": 0, "detect_zeroes": "unmap", "active": true, "image": {"backing-image": {"virtual-size": 161061273600, "filename": "/var/lib/vz/images/100102/vm-100102-disk-1.raw", "format": "raw", "actual-size": 54190236160, "dirty-flag": false}, "virtual-size": 161061273600, "filename": "json:{\"throttle-group\": \"throttle-drive-scsi0\", \"driver\": \"throttle\", \"file\": {\"driver\": \"raw\", \"file\": {\"driver\": \"file\", \"filename\": \"/var/lib/vz/images/100102/vm-100102-disk-1.raw\"}}}", "format": "throttle", "actual-size": 54190236160, "dirty-flag": false}, "iops_wr": 0, "ro": false, "children": [{"node-name": "f289c781e188435fd6f4ab27d19d84b", "child": "file"}], "node-name": "drive-scsi0", "backing_file_depth": 1, "drv": "throttle", "iops": 0, "bps_wr": 0, "write_threshold": 0, "encrypted": false, "bps": 0, "bps_rd": 0, "cache": {"no-flush": false, "direct": false, "writeback": false}, "file": "json:{\"throttle-group\": \"throttle-drive-scsi0\", \"driver\": \"throttle\", \"file\": {\"driver\": \"raw\", \"file\": {\"driver\": \"file\", \"filename\": \"/var/lib/vz/images/100102/vm-100102-disk-1.raw\"}}}"}, "qdev": "scsi0", "type": "unknown"}]}
 
Hello @dcuadrados ! Since I had upgraded to PVE 9 and at the same time enabled ZFS on my new hosts, I had random io-error on 2 or 3 VMs out of about 20 (all running linux but it happened both on RedHat-based and Debian-based distros). I was able to reproduce the issue at will on one of the VMs with a big file transfer in an application that was cached in RAM and when RAM hit 100%, it failed with io-error each time.

Found out that balooning was "off" on all my VMs. I enabled it and issue was resolved. Not sure if it is related or not to what is happening to your Windows VM but that is my experience of the last week or so and wanted to share in case it helps you or if @fiona can find anything from this information.

Also, maybe it did not happen when I was running PVE 8 because I was not using ZFS on my old nodes and now it is active on the new one so the RAM is fully used at all times for caching.

If it doesn't help, please disregard! Have a nice day! :)
Just want to add that I finally had another incident so it is not fully related to balooning and/or PVE9. This VM had about 75% RAM used also. Just unable to recreate the same scenario so it happens for other reasons. Will continue to monitor and let you know if I figure it out.
 
Hi,
Since I had upgraded to PVE 9 and at the same time enabled ZFS on my new hosts, I had random io-error on 2 or 3 VMs out of about 20 (all running linux but it happened both on RedHat-based and Debian-based distros). I was able to reproduce the issue at will on one of the VMs with a big file transfer in an application that was cached in RAM and when RAM hit 100%, it failed with io-error each time.
please share the information I asked for in my earlier response in this thread:
Hi,
please check the host system logs/journal for any messages around the time of the issue. What does zpool status -v say?

What does the following output when the VM is in IO error state, replacing 123 with the actual ID:
Code:
echo '{"execute": "qmp_capabilities"}{"execute": "query-block"}' | socat - /run/qemu-server/123.qmp
?
as well as the output of qm config 123 (again replacing 123 with the actual ID).
 
  • Like
Reactions: Taz-Matt
Hi,

please share the information I asked for in my earlier response in this thread:

as well as the output of qm config 123 (again replacing 123 with the actual ID).

Thanks for the follow-up. It seems to happen less often since I enabled balooning. But for sure I will let you know when it happens again.
 
@fiona here it is:


Code:
# zpool status -v
  pool: data
 state: ONLINE
config:

    NAME                                               STATE     READ WRITE CKSUM
    data                                               ONLINE       0     0     0
      nvme-eui.3634473052b019680025384500000003-part5  ONLINE       0     0     0
      nvme-eui.3634473052b019770025384500000003-part5  ONLINE       0     0     0

errors: No known data errors

-----

# echo '{"execute": "qmp_capabilities"}{"execute": "query-block"}' | socat - /run/qemu-server/110.qmp
{"QMP": {"version": {"qemu": {"micro": 2, "minor": 1, "major": 10}, "package": "pve-qemu-kvm_10.1.2-4"}, "capabilities": []}}
{"return": {}}
{"return": [{"io-status": "ok", "device": "", "locked": false, "removable": true, "qdev": "ide2", "tray_open": false, "type": "unknown"}, {"io-status": "nospace", "device": "", "locked": false, "removable": false, "inserted": {"iops_rd": 0, "detect_zeroes": "on", "active": true, "image": {"backing-image": {"virtual-size": 34359738368, "filename": "/var/lib/vz/images/110/vm-110-disk-0.qcow2", "cluster-size": 65536, "format": "qcow2", "actual-size": 12256150016, "format-specific": {"type": "qcow2", "data": {"compat": "1.1", "compression-type": "zlib", "lazy-refcounts": false, "refcount-bits": 16, "corrupt": false, "extended-l2": false}}, "dirty-flag": false}, "virtual-size": 34359738368, "filename": "json:{\"throttle-group\": \"throttle-drive-scsi0\", \"driver\": \"throttle\", \"file\": {\"driver\": \"qcow2\", \"file\": {\"driver\": \"file\", \"filename\": \"/var/lib/vz/images/110/vm-110-disk-0.qcow2\"}}}", "cluster-size": 65536, "format": "throttle", "actual-size": 12256150016, "dirty-flag": false}, "iops_wr": 0, "ro": false, "children": [{"node-name": "f537c6f0445eec4b8ee057a90cdb513", "child": "file"}], "node-name": "drive-scsi0", "backing_file_depth": 1, "drv": "throttle", "iops": 0, "bps_wr": 0, "write_threshold": 0, "encrypted": false, "bps": 0, "bps_rd": 0, "cache": {"no-flush": false, "direct": false, "writeback": true}, "file": "json:{\"throttle-group\": \"throttle-drive-scsi0\", \"driver\": \"throttle\", \"file\": {\"driver\": \"qcow2\", \"file\": {\"driver\": \"file\", \"filename\": \"/var/lib/vz/images/110/vm-110-disk-0.qcow2\"}}}"}, "qdev": "scsi0", "type": "unknown"}]}

-----

# qm config 110
agent: 1
boot: order=scsi0;ide2;net0
cores: 2
cpu: host
ide2: none,media=cdrom
memory: 1024
meta: creation-qemu=8.1.2,ctime=1706497241
name: ***somevm***
net0: virtio=02:00:00:xx:xx:xx,bridge=vmbr0,firewall=1
net1: virtio=BC:24:11:xx:xx:xx,bridge=vmbr1,firewall=1
numa: 0
onboot: 1
ostype: l26
scsi0: local:110/vm-110-disk-0.qcow2,format=qcow2,iothread=1,size=32G
scsihw: virtio-scsi-single
smbios1: uuid=e49a324e-57f8-4d96-a11b-b27421a6cbc8
sockets: 1
startup: order=1,up=10
vmgenid: 8b1afcbb-c890-4faf-84d4-b36e8d6103b9

-----

# Logs from /var/log/messages at the moment of the crash, followed by the reboot 14 minutes later (time to detect the downtime, login, take evidences and manually stop and start the VM)

Dec  1 22:30:05 gw1 systemd[1]: Starting dnf makecache...
Dec  1 22:30:06 gw1 dnf[7394]: AlmaLinux 9 - AppStream                          44 kB/s | 4.2 kB     00:00
Dec  1 22:30:06 gw1 dnf[7394]: AlmaLinux 9 - BaseOS                             48 kB/s | 3.8 kB     00:00
Dec  1 22:30:06 gw1 dnf[7394]: AlmaLinux 9 - Extras                             22 kB/s | 3.8 kB     00:00
Dec  1 22:30:06 gw1 dnf[7394]: Elastic repository for 9.x packages              53 kB/s | 1.7 kB     00:00
Dec  1 22:30:06 gw1 dnf[7394]: Extra Packages for Enterprise Linux 9 - x86_64   45 kB/s | 5.9 kB     00:00
Dec  1 22:30:07 gw1 dnf[7394]: Extra Packages for Enterprise Linux 9 - x86_64   48 MB/s |  20 MB     00:00
Dec  1 22:44:03 gw1 kernel: The list of certified hardware and cloud instances for Red Hat Enterprise Linux 9 can be viewed at the Red Hat Ecosystem Catalog, https://catalog.redhat.com.

I barely see any activity on the resources of the VM (CPU, RAM, Network, Disk). Everything is very low and far from any limits. Same VM as last time, this VM was migrated from a PVE 8 node to a PVE 9 node and I never saw those IO errors with any of the migrated VMs (including this one) on PVE 8. Exact same hardware was used on the baremetal server running PVE 8 and PVE 9, if that is of any help.

Thanks a lot! :)
 
Code:
"io-status": "nospace"
Are you sure your local storage has enough free space?

What do the following say?
Code:
pvesm status
df -h
qemu-img info --output=json /var/lib/vz/images/110/vm-110-disk-0.qcow2
 
Hello @fiona . Thanks for you answer. Disk space is not even close to be used on that node:
Code:
# pvesm status
Name                       Type     Status     Total (KiB)      Used (KiB) Available (KiB)        %
local                       dir     active      3576569984      1040519040      2536050944   29.09%
[...]
(trimmed the rest of the results as they are remote storages that are not used by this VM like pbs, iscsi... this VM is purely local)

This one looks good too:
Code:
# df -h
Filesystem      Size  Used Avail Use% Mounted on
udev             63G     0   63G   0% /dev
tmpfs            13G  8.1M   13G   1% /run
efivarfs        192K   64K  124K  34% /sys/firmware/efi/efivars
/dev/md3         20G  5.6G   13G  30% /
tmpfs            63G   66M   63G   1% /dev/shm
tmpfs           5.0M     0  5.0M   0% /run/lock
tmpfs           1.0M     0  1.0M   0% /run/credentials/systemd-journald.service
/dev/md2        988M  228M  693M  25% /boot
tmpfs            63G     0   63G   0% /tmp
/dev/md1        511M  176K  511M   1% /boot/efi
data/zd0        3.4T  993G  2.4T  30% /var/lib/vz
/dev/fuse       128M   56K  128M   1% /etc/pve
tmpfs           1.0M     0  1.0M   0% /run/credentials/getty@tty1.service
tmpfs           1.0M     0  1.0M   0% /run/credentials/serial-getty@ttyS1.service
tmpfs            13G  8.0K   13G   1% /run/user/0

And for the details of the vm disk:
Code:
# qemu-img info --output=json /var/lib/vz/images/110/vm-110-disk-0.qcow2
{
    "children": [
        {
            "name": "file",
            "info": {
                "children": [
                ],
                "virtual-size": 34365243392,
                "filename": "/var/lib/vz/images/110/vm-110-disk-0.qcow2",
                "format": "file",
                "actual-size": 12256150016,
                "format-specific": {
                    "type": "file",
                    "data": {
                    }
                },
                "dirty-flag": false
            }
        }
    ],
    "virtual-size": 34359738368,
    "filename": "/var/lib/vz/images/110/vm-110-disk-0.qcow2",
    "cluster-size": 65536,
    "format": "qcow2",
    "actual-size": 12256150016,
    "format-specific": {
        "type": "qcow2",
        "data": {
            "compat": "1.1",
            "compression-type": "zlib",
            "lazy-refcounts": false,
            "refcount-bits": 16,
            "corrupt": false,
            "extended-l2": false
        }
    },
    "dirty-flag": false
}

Thanks again, really appreciate it. Like I said, never happened in the past year and more, with the same VMs, on PVE 8, same hardware (even also different hardware a year ago). It only happened since I moved to PVE 9 and am using local storage over ZFS (instead of local storage without ZFS) about 2 weeks ago.

Ballooning seems to help, but not completely remove the behavior. I am talking about memory because after first searching for disks like you are asking me right now, I asked an AI and after giving some details, it went to memory allocation because memory does have high usage because of ZFS ARC (screenshot). Note that the last issue happened at 21:30 in this graph so nothing shows signs of major changes at that time and there is plenty of RAM left for a VM configured at 1GB RAM and using about 600MB (the VM is basically a linux router).
 

Attachments

  • Screenshot 2025-12-02 at 07.43.05.png
    Screenshot 2025-12-02 at 07.43.05.png
    43.5 KB · Views: 3
What does qemu-img check /var/lib/vz/images/110/vm-110-disk-0.qcow2 say (while the VM is shut down)? Could you also check your system journal for messages around the time of the issue, i.e. with the journalctl command.

In general, using qcow2 on top of ZFS is not recommended, because it means having duplicate copy-on-write operations. But of course, there's still a bug here, because that should only hurt performance and not lead to issues like this.
 
Hello @fiona , thanks again for the follow-up. Here is the result of the command with the VM stopped (note, exact same result while running):
Code:
# qemu-img check /var/lib/vz/images/110/vm-110-disk-0.qcow2
No errors were found on the image.
524288/524288 = 100.00% allocated, 0.00% fragmented, 0.00% compressed clusters
Image end offset: 34365243392

Also thanks for letting me know about the qcow2 over ZFS. I did not know about that detail and it was probably the right type on my previous setup without ZFS. What do you recommend? Raw?

Thanks!
Mathieu