Backup jobs hang on 4.0.18 S3 storage

dw-cj

Member
Apr 9, 2024
46
2
8
I've noticed this only since upgrading to 4.0.18. We have several nodes with backup jobs that run daily. When backups trigger in the morning, all of the jobs in PBS hang at this status:

Code:
2025-10-31T03:25:57-04:00: starting new backup on datastore 'dw-pbs-ny' from ::ffff:172.81.128.10: "vm/5142/2025-10-31T07:25:54Z"
2025-10-31T03:25:57-04:00: download 'index.json.blob' from previous backup 'vm/5142/2025-10-24T07:04:23Z'.
2025-10-31T03:25:57-04:00: register chunks in 'drive-virtio0.img.fidx' from previous backup 'vm/5142/2025-10-24T07:04:23Z'.
2025-10-31T03:25:57-04:00: download 'drive-virtio0.img.fidx' from previous backup 'vm/5142/2025-10-24T07:04:23Z'.
2025-10-31T03:25:57-04:00: created new fixed index 1 ("vm/5142/2025-10-31T07:25:54Z/drive-virtio0.img.fidx")

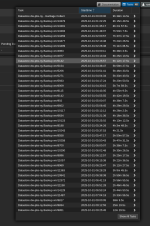
This results in 50+ backup jobs hung on the PBS server, they will just sit in this status forever and never time out:
1761917902427.png


The jobs on the Proxmox nodes do timeout and fail:
Code:
INFO: Starting Backup of VM 5154 (qemu)
INFO: Backup started at 2025-10-31 02:38:47
INFO: status = running
INFO: VM Name: Server
INFO: include disk 'scsi0' 'local:5154/vm-5154-disk-0.raw' 80G
INFO: backup mode: snapshot
INFO: ionice priority: 7
INFO: creating Proxmox Backup Server archive 'vm/5154/2025-10-31T07:38:47Z'
ERROR: VM 5154 qmp command 'backup' failed - got timeout
INFO: aborting backup job
ERROR: VM 5154 qmp command 'backup-cancel' failed - got timeout
INFO: resuming VM again
ERROR: Backup of VM 5154 failed - VM 5154 qmp command 'cont' failed - got timeout

The PBS node gets into this 'state' almost daily. Whenever this happens, every VM I backup hangs like this, even a newly created VM with no previous backups. The only fix I've found is to reboot the node, then backups start working normally again. This has been happening almost every day since I upgraded to 4.0.18. This is on an S3 datastore using Backblaze B2.
 
Hi,
can you please verify at which stage the garbage collection is when this happens? Seems like the GC hangs and holds a lock, blocking any backup inserts.

Edit: Please also share the systemd journal from the affected timespan.
 
Last edited:
Hi,
can you please verify at which stage the garbage collection is when this happens? Seems like the GC hangs and holds a lock, blocking any backup inserts.
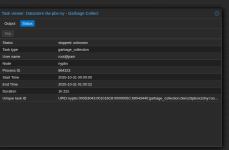
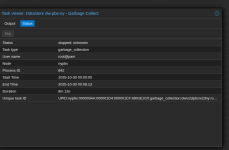
The most recent garbage collect seems to have started at 12:00am, and 'finished' a little after 1:00am. These backup tasks were still hung at 9am this morning. The garbage collect from yesterday only lasted 8 minutes, and hung on the 'stage 2' line.

I do notice the garbage collect status is 'stopped: unknown' instead of OK. I've attached the log for GC Job from today, and the day before.

1761919354185.png

1761919385941.png
 

Attachments

Could you also get the systemd journal for the affected timespan journalctl --since <datetime> > journal.txt

Edit: and the task log of the datastore re-creation you performed yesterday.
 
Last edited:
Could you also get the systemd journal for the affected timespan journalctl --since <datetime> > journal.txt
Attached, and filtered out some junk. I also re-created this datastore last night.

Code:
journalctl --since "24 hours ago" --no-pager | grep -v rpc | grep -v "maintenance mode" | grep -v sshd | grep -v "pam_unix" | grep -v "unix_chkpwd" | grep -v hetrix | grep -v postfix | grep -v badger > log.txt

/juicefs_cache/pbscache/ is my new (current datastore)
/juicefs_cache/pbs/ was my old datastore, before re-creating.
 

Attachments

What filesystem is used for the local store cache? I see juicefs?
 
What filesystem is used for the local store cache? I see juicefs?
It is just using the same directory that we use for juicefs caching. juicefs is not actually used at all for this. "/juicefs_cache/" is an ext4 mount on an SSD.

Code:
/dev/sdb1                                     938G  392G  499G  44% /juicefs_cache
 
I'm asking since your systemd journal shows some kernel IO related hangs. E.g.
Code:
Oct 30 23:12:10 nypbs proxmox-backup-proxy[864323]: Upload backup log to datastore 'dw-pbs-ny', root namespace vm/7819/2025-10-31T03:02:00Z/client.log.blob
Oct 30 23:17:01 nypbs CRON[2279120]: (root) CMD (cd / && run-parts --report /etc/cron.hourly)
Oct 30 23:19:21 nypbs kernel: INFO: task tokio-runtime-w:2210959 blocked for more than 122 seconds.
Oct 30 23:19:21 nypbs kernel:       Tainted: P           O       6.14.11-3-pve #1
Oct 30 23:19:21 nypbs kernel: "echo 0 > /proc/sys/kernel/hung_task_timeout_secs" disables this message.
Oct 30 23:19:21 nypbs kernel: task:tokio-runtime-w state:D stack:0     pid:2210959 tgid:864323 ppid:1      task_flags:0x400040 flags:0x00000002
Oct 30 23:19:21 nypbs kernel: Call Trace:
Oct 30 23:19:21 nypbs kernel:  <TASK>
Oct 30 23:19:21 nypbs kernel:  __schedule+0x466/0x1400
Oct 30 23:19:21 nypbs kernel:  ? __queue_delayed_work+0x112/0x170
Oct 30 23:19:21 nypbs kernel:  ? mod_delayed_work_on+0xb0/0xc0
Oct 30 23:19:21 nypbs kernel:  schedule+0x29/0x130
Oct 30 23:19:21 nypbs kernel:  wb_wait_for_completion+0x8f/0xc0
Oct 30 23:19:21 nypbs kernel:  ? __pfx_autoremove_wake_function+0x10/0x10
Oct 30 23:19:21 nypbs kernel:  __writeback_inodes_sb_nr+0x9d/0xd0
Oct 30 23:19:21 nypbs kernel:  writeback_inodes_sb+0x3c/0x60
Oct 30 23:19:21 nypbs kernel:  sync_filesystem+0x3d/0xb0
Oct 30 23:19:21 nypbs kernel:  __x64_sys_syncfs+0x46/0xb0
Oct 30 23:19:21 nypbs kernel:  x64_sys_call+0x10bc/0x2310
Oct 30 23:19:21 nypbs kernel:  do_syscall_64+0x7e/0x170
Oct 30 23:19:21 nypbs kernel:  ? ksys_write+0x9b/0xf0
Oct 30 23:19:21 nypbs kernel:  ? arch_exit_to_user_mode_prepare.isra.0+0x22/0x120
Oct 30 23:19:21 nypbs kernel:  ? syscall_exit_to_user_mode+0x38/0x1d0
Oct 30 23:19:21 nypbs kernel:  ? do_syscall_64+0x8a/0x170
Oct 30 23:19:21 nypbs kernel:  ? sched_tick+0x11b/0x330
Oct 30 23:19:21 nypbs kernel:  ? rcu_report_qs_rnp+0xd1/0x140
Oct 30 23:19:21 nypbs kernel:  ? rcu_core+0x1bb/0x380
Oct 30 23:19:21 nypbs kernel:  ? rcu_core_si+0xe/0x20
Oct 30 23:19:21 nypbs kernel:  ? handle_softirqs+0xd9/0x2a0
Oct 30 23:19:21 nypbs kernel:  ? arch_exit_to_user_mode_prepare.isra.0+0x22/0x120
Oct 30 23:19:21 nypbs kernel:  ? irqentry_exit_to_user_mode+0x2d/0x1d0
Oct 30 23:19:21 nypbs kernel:  ? irqentry_exit+0x43/0x50
Oct 30 23:19:21 nypbs kernel:  ? sysvec_apic_timer_interrupt+0x57/0xc0
Oct 30 23:19:21 nypbs kernel:  entry_SYSCALL_64_after_hwframe+0x76/0x7e
Oct 30 23:19:21 nypbs kernel: RIP: 0033:0x74488a318737
Oct 30 23:19:21 nypbs kernel: RSP: 002b:00007447fbbfb9a8 EFLAGS: 00000202 ORIG_RAX: 0000000000000132
Oct 30 23:19:21 nypbs kernel: RAX: ffffffffffffffda RBX: 000000000000000a RCX: 000074488a318737
Oct 30 23:19:21 nypbs kernel: RDX: 000074477c00ece0 RSI: 0000000000000006 RDI: 000000000000000a
Oct 30 23:19:21 nypbs kernel: RBP: 0000000000000000 R08: 0000000000000020 R09: 0000000000000000
Oct 30 23:19:21 nypbs kernel: R10: 0000000000000000 R11: 0000000000000202 R12: 0000000000000001
Oct 30 23:19:21 nypbs kernel: R13: 00005e80139c3af8 R14: 0000744884059b10 R15: 000074477c032de0
Oct 30 23:19:21 nypbs kernel:  </TASK>

Could you maybe check the iodelay during that timespan?
 
I
I'm asking since your systemd journal shows some kernel IO related hangs. E.g.
Code:
Oct 30 23:12:10 nypbs proxmox-backup-proxy[864323]: Upload backup log to datastore 'dw-pbs-ny', root namespace vm/7819/2025-10-31T03:02:00Z/client.log.blob
Oct 30 23:17:01 nypbs CRON[2279120]: (root) CMD (cd / && run-parts --report /etc/cron.hourly)
Oct 30 23:19:21 nypbs kernel: INFO: task tokio-runtime-w:2210959 blocked for more than 122 seconds.
Oct 30 23:19:21 nypbs kernel:       Tainted: P           O       6.14.11-3-pve #1
Oct 30 23:19:21 nypbs kernel: "echo 0 > /proc/sys/kernel/hung_task_timeout_secs" disables this message.
Oct 30 23:19:21 nypbs kernel: task:tokio-runtime-w state:D stack:0     pid:2210959 tgid:864323 ppid:1      task_flags:0x400040 flags:0x00000002
Oct 30 23:19:21 nypbs kernel: Call Trace:
Oct 30 23:19:21 nypbs kernel:  <TASK>
Oct 30 23:19:21 nypbs kernel:  __schedule+0x466/0x1400
Oct 30 23:19:21 nypbs kernel:  ? __queue_delayed_work+0x112/0x170
Oct 30 23:19:21 nypbs kernel:  ? mod_delayed_work_on+0xb0/0xc0
Oct 30 23:19:21 nypbs kernel:  schedule+0x29/0x130
Oct 30 23:19:21 nypbs kernel:  wb_wait_for_completion+0x8f/0xc0
Oct 30 23:19:21 nypbs kernel:  ? __pfx_autoremove_wake_function+0x10/0x10
Oct 30 23:19:21 nypbs kernel:  __writeback_inodes_sb_nr+0x9d/0xd0
Oct 30 23:19:21 nypbs kernel:  writeback_inodes_sb+0x3c/0x60
Oct 30 23:19:21 nypbs kernel:  sync_filesystem+0x3d/0xb0
Oct 30 23:19:21 nypbs kernel:  __x64_sys_syncfs+0x46/0xb0
Oct 30 23:19:21 nypbs kernel:  x64_sys_call+0x10bc/0x2310
Oct 30 23:19:21 nypbs kernel:  do_syscall_64+0x7e/0x170
Oct 30 23:19:21 nypbs kernel:  ? ksys_write+0x9b/0xf0
Oct 30 23:19:21 nypbs kernel:  ? arch_exit_to_user_mode_prepare.isra.0+0x22/0x120
Oct 30 23:19:21 nypbs kernel:  ? syscall_exit_to_user_mode+0x38/0x1d0
Oct 30 23:19:21 nypbs kernel:  ? do_syscall_64+0x8a/0x170
Oct 30 23:19:21 nypbs kernel:  ? sched_tick+0x11b/0x330
Oct 30 23:19:21 nypbs kernel:  ? rcu_report_qs_rnp+0xd1/0x140
Oct 30 23:19:21 nypbs kernel:  ? rcu_core+0x1bb/0x380
Oct 30 23:19:21 nypbs kernel:  ? rcu_core_si+0xe/0x20
Oct 30 23:19:21 nypbs kernel:  ? handle_softirqs+0xd9/0x2a0
Oct 30 23:19:21 nypbs kernel:  ? arch_exit_to_user_mode_prepare.isra.0+0x22/0x120
Oct 30 23:19:21 nypbs kernel:  ? irqentry_exit_to_user_mode+0x2d/0x1d0
Oct 30 23:19:21 nypbs kernel:  ? irqentry_exit+0x43/0x50
Oct 30 23:19:21 nypbs kernel:  ? sysvec_apic_timer_interrupt+0x57/0xc0
Oct 30 23:19:21 nypbs kernel:  entry_SYSCALL_64_after_hwframe+0x76/0x7e
Oct 30 23:19:21 nypbs kernel: RIP: 0033:0x74488a318737
Oct 30 23:19:21 nypbs kernel: RSP: 002b:00007447fbbfb9a8 EFLAGS: 00000202 ORIG_RAX: 0000000000000132
Oct 30 23:19:21 nypbs kernel: RAX: ffffffffffffffda RBX: 000000000000000a RCX: 000074488a318737
Oct 30 23:19:21 nypbs kernel: RDX: 000074477c00ece0 RSI: 0000000000000006 RDI: 000000000000000a
Oct 30 23:19:21 nypbs kernel: RBP: 0000000000000000 R08: 0000000000000020 R09: 0000000000000000
Oct 30 23:19:21 nypbs kernel: R10: 0000000000000000 R11: 0000000000000202 R12: 0000000000000001
Oct 30 23:19:21 nypbs kernel: R13: 00005e80139c3af8 R14: 0000744884059b10 R15: 000074477c032de0
Oct 30 23:19:21 nypbs kernel:  </TASK>

Could you maybe check the iodelay during that timespan?
I do not ice some iowait spikes during that time period and the hour before, but it only lasted for 30 minutes or so, then dropped down to normal. Shouldn't there be errors in the garbage collection job if that was causing issues though?
 
I

I do not ice some iowait spikes during that time period and the hour before, but it only lasted for 30 minutes or so, then dropped down to normal. Shouldn't there be errors in the garbage collection job if that was causing issues though?
Not if the IO never completes, how big are the spikes? Could you maybe move to a dedicated disk for the cache? And check if you see stale IO in the output of ps auxwf (or htop), especially related to the proxmox-backup-proxy
 
Not if the IO never completes, how big are the spikes? Could you maybe move to a dedicated disk for the cache? And check if you see stale IO in the output of ps auxwf (or htop), especially related to the proxmox-backup-proxy
IO isnt the issue, this never happened until we upgraded to 4.0.18. Every morning the GC breaks something and all of the tasks get stuck on 'unknown' state.
 
Code:
root@nypbs:~# ps auxwf | grep -i proxmox
backup   1703580 16.6  0.5 1022428 175188 ?      Ssl  11:28   0:31 /usr/lib/x86_64-linux-gnu/proxmox-backup/proxmox-backup-proxy
root     1704132  8.6  0.0 730964 28320 ?        Ssl  11:28   0:15 /usr/lib/x86_64-linux-gnu/proxmox-backup/proxmox-backup-api
root     1719939  0.0  0.0   6528  2228 pts/1    S+   11:31   0:00  |           \_ grep -i proxmox
root@nypbs:~# ps auxwf | grep -i backup
backup   1703580 17.1  0.5 1022428 182928 ?      Ssl  11:28   0:33 /usr/lib/x86_64-linux-gnu/proxmox-backup/proxmox-backup-proxy
root     1704132  8.6  0.0 729340 27592 ?        Ssl  11:28   0:16 /usr/lib/x86_64-linux-gnu/proxmox-backup/proxmox-backup-api
root     1720642  0.0  0.0   6528  2220 pts/1    S+   11:31   0:00              \_ grep -i backup
root@nypbs:~#
 
Version 4.0.18-1 did not have any changes related to garbage collection though, what version was running before the upgrade?
 
At this point I'm considering just deleting the datastore and reinstalling the box, and re adding it using 'Existing S3 bucket' flag. Between the renaming bugs, verification bugs, in place upgrade from PBS 3.x to 4.x, and switching between 'test' repo versions, maybe something is just messed up on here. I don't want to waste your time if this isn't an actual PBS bug.

@Chris When I re-set this all up, I'd like to 'purge' corrupted backups from my datastore somehow. Is there any way for me to do this without fully 'verifying' every single backup in there? I'd also like to ensure that any 'falsely renamed' backups are not marked as such before doing so. Do I just drop the .bad extension from all chunks first?
 
At this point I'm considering just deleting the datastore and reinstalling the box, and re adding it using 'Existing S3 bucket' flag. Between the renaming bugs, verification bugs, in place upgrade from PBS 3.x to 4.x, and switching between 'test' repo versions, maybe something is just messed up on here. I don't want to waste your time if this isn't an actual PBS bug.
I'm afraid that won't help, this rather smells like a deadlock. Can you please try to generate a backtrace once the GC is hanging with the steps as described here? That would at least help to understand why the garbage collection cannot make progress. I do not think that re-installation will solve this issue here.

@Chris When I re-set this all up, I'd like to 'purge' corrupted backups from my datastore somehow. Is there any way for me to do this without fully 'verifying' every single backup in there? I'd also like to ensure that any 'falsely renamed' backups are not marked as such before doing so. Do I just drop the .bad extension from all chunks first?
Yes, dropping any .0.bad extension will help to at least re-consider that chunk for verification and making it available. But there is no way of knowing if the snapshot is good without verification. Please be aware of potential additional costs if you do the verify job.
 
I'm afraid that won't help, this rather smells like a deadlock. Can you please try to generate a backtrace once the GC is hanging with the steps as described here? That would at least help to understand why the garbage collection cannot make progress. I do not think that re-installation will solve this issue here.


Yes, dropping any .0.bad extension will help to at least re-consider that chunk for verification and making it available. But there is no way of knowing if the snapshot is good without verification. Please be aware of potential additional costs if you do the verify job.
It looks like the GC job is hung right now. Box has 0-1% iowait. The last message from the GC job was this, almost 2 hours ago, yet it is still 'running'.

Code:
2025-11-03T12:02:18-05:00: Not found, mark for deletion: dw-pbs-ny/.chunks/62f8/62f8d609044e2e660ac60c8bbc9030777348cdee6e26d0f3ade75d2d46a54368

I have installed debug symbols and attached the GDB log generated per the command in the other thread. I took the dump twice.

The first time I did it using the PBS in browser terminal (backtrace1.txt), which hung (assuming because the terminal is powered by the proxmox-backup-proxy process). After a few minutes the process un-hung and the log was outputted. The second time I did it over an SSH session (backtrace2.txt). I let it sit here for 10 minutes and it was still hung, at which point I ctrl+c'd it.

Code:
root@nypbs:~# gdb --batch --ex 't a a bt' -p $(pidof proxmox-backup-proxy) > proxy.backtrace.1
warning: Missing auto-load script at offset 0 in section .debug_gdb_scripts
of file /usr/lib/x86_64-linux-gnu/proxmox-backup/proxmox-backup-proxy.
Use `info auto-load python-scripts [REGEXP]' to list them.

Let me know if I need to take the backtraces again.
 

Attachments