PVE 9 Strange CPU Stats

dw-cj

New Member
Apr 9, 2024
23
1
3
Did CPU accounting change from PVE 8 to PVE 9? I run 50+ nodes all on PVE 8. I've started provisioning my new nodes with PVE 9, and I'm seeing weird stats. A lot of VMs I'm seeing report 120%-160% CPU usage. I don't think I've ever seen over 101% on PVE 8, ever. Additionally, my CPU throttling algorithm (which relies on the 'daily' CPU RRD data) seems to not work the same as before. Can a dev tell me if anything changed regarding CPU accounting in PVE 9?

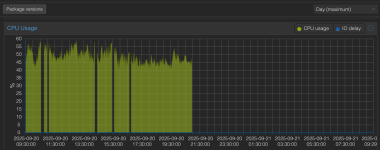
I've also noticed that in PVE 9, the "Day (Maximum)" and "Day (Average)" graphs are the same. In PVE 8 they differed.
 
Last edited:
Additionally, the graphs seem to be way more 'granular' and 'bursty' (if that is the right word to describe it) in PVE 9 vs PVE 8. The images below of the 'Day (Average)' CPU graphs describe what I mean. I suspect that whatever changed in this graphing / data collection is what is causing my CPU throttling algorithm to fail.

PVE 8 Examples:
1758127482272.png
1758127505219.png


PVE 9 Examples:
1758127539657.png
1758127575875.png
 
Hi,
from the roadmap:
Increase the RRD guest metrics aggregation window to provide greater temporal granularity.The following resolutions are now available: one point per minute for a day, one point every 30 minutes for a month, one point every six hours for a year, and one point per week for a decade.These options now match the Proxmox Backup Server metric aggregation.
 
  • Like
Reactions: Johannes S
Hi,
from the roadmap:
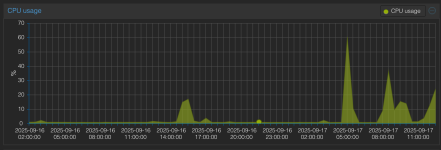
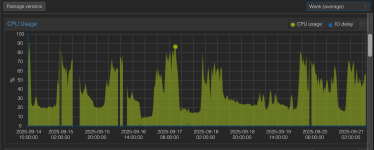
Thank you, that gives me some insight. However, I'm also noticing another 'bug' with this new reporting system. Once CPU usage gets too high, PVESTATD fails to record data. On PVE 8, I never had this issue. Any node could get to 100% CPU, and data would still be recorded. However, on my 3-5 PVE 9 nodes I now have setup, I've moticed that whenever CPU usage goes too high on the host node, data stops being recorded. This results in my throttling system not working, because it has no data to read. During the gaps, the load and CPU usage is always high. I have only seen this on my PVE 9 nodes See the images below:
1758461467837.png
1758461364077.png
 
Could you check your system journals for any errors around this time? Running stress-ng on a node, I can see even 100% being recorded just fine, so I'd guess that the "not recording" is just a symptom of something not working because of too high load.
 
Could you check your system journals for any errors around this time? Running stress-ng on a node, I can see even 100% being recorded just fine, so I'd guess that the "not recording" is just a symptom of something not working because of too high load.
Hi Fiona,

I've already checked this, there are no strange or unexpected errors during these time periods ever. It is definietly load related though. As soon as I identify the VMs with high load and throttle them manually, stats come back. I have recording from HetrixTools, and it shows host CPU at 80-90% during the times when recording fails. Like I said, we've had plenty of VM nodes go into periods of high usage on PVE 8, even worse than this, and never had stat recording fail this drastically. I've seen this same issue on several PVE 9 nodes.

When I check pvestatd logs, I see that sometimes the 'status update times' are much lower:

Code:
Sep 18 06:29:46 ny15 pvestatd[1758513]: status update time (81.733 seconds)
Sep 18 06:30:54 ny15 pvestatd[1758513]: status update time (67.683 seconds)
Sep 18 06:32:01 ny15 pvestatd[1758513]: status update time (67.530 seconds)
Sep 18 06:33:10 ny15 pvestatd[1758513]: status update time (68.584 seconds)
Sep 18 06:34:12 ny15 pvestatd[1758513]: status update time (62.299 seconds)
Sep 18 06:35:15 ny15 pvestatd[1758513]: status update time (63.365 seconds)

And then sometimes they are 2-3x this amount:
Code:
Sep 21 02:32:17 ny15 pvestatd[1758513]: status update time (178.485 seconds)
Sep 21 02:35:18 ny15 pvestatd[1758513]: status update time (180.397 seconds)
Sep 21 02:38:49 ny15 pvestatd[1758513]: status update time (211.338 seconds)
Sep 21 02:42:24 ny15 pvestatd[1758513]: status update time (214.614 seconds)
Sep 21 02:45:50 ny15 pvestatd[1758513]: status update time (205.747 seconds)
Sep 21 02:49:15 ny15 pvestatd[1758513]: status update time (205.794 seconds)
Sep 21 02:52:35 ny15 pvestatd[1758513]: status update time (200.068 seconds)
Sep 21 02:55:36 ny15 pvestatd[1758513]: status update time (180.353 seconds)
Sep 21 02:58:49 ny15 pvestatd[1758513]: status update time (192.920 seconds)
Sep 21 03:01:58 ny15 pvestatd[1758513]: status update time (189.682 seconds)

I also see this occasionally, but I think it's expected?
Code:
Sep 21 12:41:32 ny15 pvestatd[1758513]: restarting server after 1341 cycles to reduce memory usage (free 139736 (15368) KB)
Sep 21 12:41:32 ny15 pvestatd[1758513]: server shutdown (restart)
Sep 21 12:41:33 ny15 pvestatd[1758513]: restarting server

I'm assuming the more granular stat recording is more resource intensive. The problem for us is that we rely on these stats to throttle VMs when resources are exhausted. If the stats don't work in the case of high resource usage, it's useless.
 
And then sometimes they are 2-3x this amount:
Code:
Sep 21 02:32:17 ny15 pvestatd[1758513]: status update time (178.485 seconds)
Sep 21 02:35:18 ny15 pvestatd[1758513]: status update time (180.397 seconds)
Sep 21 02:38:49 ny15 pvestatd[1758513]: status update time (211.338 seconds)
Sep 21 02:42:24 ny15 pvestatd[1758513]: status update time (214.614 seconds)
Sep 21 02:45:50 ny15 pvestatd[1758513]: status update time (205.747 seconds)
Sep 21 02:49:15 ny15 pvestatd[1758513]: status update time (205.794 seconds)
Sep 21 02:52:35 ny15 pvestatd[1758513]: status update time (200.068 seconds)
Sep 21 02:55:36 ny15 pvestatd[1758513]: status update time (180.353 seconds)
Sep 21 02:58:49 ny15 pvestatd[1758513]: status update time (192.920 seconds)
Sep 21 03:01:58 ny15 pvestatd[1758513]: status update time (189.682 seconds)
This does mean that during this period, there are only one data point every 3-4 minutes and that might will be the reason for the "holes". If the reason really is the too high load, then I'm not sure what could be done on the Proxmox VE side. If it's too overloaded to collect/send the stats, then you will see that there are missing data points. Could you check in the raw data if you do see singular data points every few minutes?

What you can try is to base the throttling decisions not on the CPU usage, but the pressure stall information (PSI) that's newly collected in Proxmox VE 9. This is in general the much better information detecting hogs. And if that still doesn't help, you could try to have the throttling kick in earlier.

I also see this occasionally, but I think it's expected?
Code:
Sep 21 12:41:32 ny15 pvestatd[1758513]: restarting server after 1341 cycles to reduce memory usage (free 139736 (15368) KB)
Sep 21 12:41:32 ny15 pvestatd[1758513]: server shutdown (restart)
Sep 21 12:41:33 ny15 pvestatd[1758513]: restarting server
Yes, this is expected. The daemon restarts to reduce its memory usage.
 
This does mean that during this period, there are only one data point every 3-4 minutes and that might will be the reason for the "holes". If the reason really is the too high load, then I'm not sure what could be done on the Proxmox VE side. If it's too overloaded to collect/send the stats, then you will see that there are missing data points. Could you check in the raw data if you do see singular data points every few minutes?

What you can try is to base the throttling decisions not on the CPU usage, but the pressure stall information (PSI) that's newly collected in Proxmox VE 9. This is in general the much better information detecting hogs. And if that still doesn't help, you could try to have the throttling kick in earlier.


Yes, this is expected. The daemon restarts to reduce its memory usage.
We never had this issue on PVE 8, and have been running the same setup for years on a ton of nodes. We can't really use CPU pressure stall either, because that RRD data is also not recorded during this time period. Does rrdcached fail to 'consolidate' the data if there aren't enough points recording in the 30 minute window? Is there anything we can adjust to fix this? The node also isn't **that** resource exhausted when this is going on. This starts to happen anytime CPU is at 80 - 90%, according to our Hetrix monitoring. All other tasks running on the host function fine (PVE API, NFS servers, everything else). It just seems to be pvestatd choking.

I checked both of the time periods from which I pasted logs above with rrdtool.

Sep 21, 02:32 → 03:02 UTC (print raw CPU datapoints for this window):
Code:
root@ny15:~# rrd=/var/lib/rrdcached/db/pve-node-9.0/ny15; S=$(TZ=UTC date -d '2025-09-21 02:32:00' +%s); E=$(TZ=UTC date -d '2025-09-21 03:02:00' +%s); rrdtool fetch "$rrd" AVERAGE -r 60 -s "$S" -e "$E" | awk '$1~/^[0-9]+:$/ {ts=$1; gsub(":","",ts); cmd="date -u -d @"ts" +\"%F %T\""; cmd|getline h; close(cmd); print h,"cpu=",$4}'
2025-09-21 03:00:00 cpu= -nan
2025-09-21 03:30:00 cpu= -nan


Sep 18, 06:29:46 → 06:59:46 UTC (print raw CPU datapoints for this window)
Code:
root@ny15:~# rrd=/var/lib/rrdcached/db/pve-node-9.0/ny15; S=$(TZ=UTC date -d '2025-09-18 06:29:46' +%s); E=$((S+30*60)); rrdtool fetch "$rrd" AVERAGE -r 60 -s "$S" -e "$E" | awk '$1~/^[0-9]+:$/ {ts=$1; gsub(":","",ts); cmd="date -u -d @"ts" +\"%F %T\""; cmd|getline h; close(cmd); print h,"cpu=",$4}'
2025-09-18 06:30:00 cpu= 4.3883318097e-01
2025-09-18 07:00:00 cpu= 4.5756005054e-01
 
Another thing I've noticed from PVE8 -> PVE9 is that 'qm list' / PVE API to list VMs takes **much** longer. I investigated this myself and found via strace that qm list spends a lot of time reading smaps_rollup, and IO pressure, CPU pressure, and memory pressure for each VM. I'm assuming this may also be why pvestatd lags? With hundreds of VMs, I can see why the additional resource collection takes longer...
 
Upon further investigation, perhaps bumping this up from 120s would fix the issue? I'm no expert on rrd though.

Code:
ds[cpu].minimal_heartbeat = 120
 
Upon further investigation, perhaps bumping this up from 120s would fix the issue? I'm no expert on rrd though.

Code:
ds[cpu].minimal_heartbeat = 120
After setting all minimal_heartbeat values in the RRD files to 600s, the graphs stopped having gaps. With this change, my throttling algorithm can now correctly detect when VMs are abusing CPU and apply limits. I’m not sure how to make minimal_heartbeat default to a higher value without modifying the PVE codebase itself. For anyone curious, here’s the script I used:

Code:
base=/var/lib/rrdcached/db; hb=600; sock=unix:/var/run/rrdcached.sock
find "$base" -type f -print0 | while IFS= read -r -d '' rrd; do
  while read -r ds; do
    rrdtool tune "$rrd" --daemon "$sock" --heartbeat "$ds:$hb" >/dev/null
  done < <(rrdtool info "$rrd" | awk -F'[][]' '/^ds\[/ {print $2}')
  rrdtool flushcached --daemon "$sock" "$rrd"
  echo "tuned: $rrd"
done

What still puzzles me is why pvestatd bogs down so badly under certain loads—even though the host isn’t resource-starved (CPU hovers with 10–20% free and everything else runs smoothly). For some reason, it just takes forever to pull stats during these periods, which makes me wonder if there’s an underlying bug with pvestatd.