Hi,
I'm running Proxmox VE on a Dell Precision 3660 Tower Workstation on ZFS with 128 GB RAM and 13th Gen Intel i9-13900K (24 Cores, 32 Threads).
Every couple of weeks the Proxmox VE gets stuck because of a very high load average due to processes z_wr_iss, so that only a hard reset works.
I've checked the logs and performed several hardware checks (disks, RAM, ...). No hardware issues reported, though.
I've already found similar issues in this forum, but they're related to older kernels.
Some additional information:
uname -a
df -h
zpool status
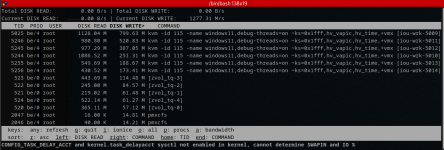
top
Thank you in advance.
Best Regards,
Dennis
I'm running Proxmox VE on a Dell Precision 3660 Tower Workstation on ZFS with 128 GB RAM and 13th Gen Intel i9-13900K (24 Cores, 32 Threads).
Every couple of weeks the Proxmox VE gets stuck because of a very high load average due to processes z_wr_iss, so that only a hard reset works.
I've checked the logs and performed several hardware checks (disks, RAM, ...). No hardware issues reported, though.
I've already found similar issues in this forum, but they're related to older kernels.
Some additional information:
uname -a
Linux workstation 6.8.12-2-pve #1 SMP PREEMPT_DYNAMIC PMX 6.8.12-2 (2024-09-05T10:03Z) x86_64 GNU/Linux
df -h
Filesystem Size Used Avail Use% Mounted on
udev 63G 0 63G 0% /dev
tmpfs 13G 3.1M 13G 1% /run
rpool/ROOT/pve-1 2.7T 342G 2.4T 13% /
tmpfs 63G 46M 63G 1% /dev/shm
tmpfs 5.0M 0 5.0M 0% /run/lock
efivarfs 438K 359K 75K 83% /sys/firmware/efi/efivars
rpool 2.4T 128K 2.4T 1% /rpool
rpool/var-lib-vz 2.4T 128K 2.4T 1% /var/lib/vz
rpool/ROOT 2.4T 128K 2.4T 1% /rpool/ROOT
rpool/data 2.4T 128K 2.4T 1% /rpool/data
/dev/fuse 128M 48K 128M 1% /etc/pve
tmpfs 13G 0 13G 0% /run/user/0
zpool status
pool: rpool
state: ONLINE
config:
NAME STATE READ WRITE CKSUM
rpool ONLINE 0 0 0
nvme-eui.0025384b3143ad0d-part3 ONLINE 0 0 0
nvme-eui.0025384b3143ad13-part3 ONLINE 0 0 0
errors: No known data errors
top
As we can see from top, this shouldn't be a memory-related issue, since most of the memory is free, even though the load average of 34.68 is very high due to high CPU utilization.top - 15:58:04 up 8:21, 2 users, load average: 34.68, 33.16, 25.85
Tasks: 625 total, 3 running, 622 sleeping, 0 stopped, 0 zombie
%Cpu(s): 0.0 us, 6.9 sy, 0.0 ni, 64.1 id, 29.1 wa, 0.0 hi, 0.0 si, 0.0 st
MiB Mem : 128501.2 total, 113606.5 free, 15648.2 used, 223.7 buff/cache
MiB Swap: 0.0 total, 0.0 free, 0.0 used. 112853.0 avail Mem
PID USER PR NI VIRT RES SHR S %CPU %MEM TIME+ COMMAND
117816 root 1 -19 0 0 0 R 5.6 0.0 1:18.74 z_wr_iss
630 root 1 -19 0 0 0 S 5.3 0.0 2:41.88 z_wr_iss
112681 root 1 -19 0 0 0 S 5.3 0.0 1:19.29 z_wr_iss
114908 root 1 -19 0 0 0 S 5.3 0.0 1:18.93 z_wr_iss
115232 root 1 -19 0 0 0 S 5.3 0.0 1:19.10 z_wr_iss
115632 root 1 -19 0 0 0 S 5.3 0.0 1:18.99 z_wr_iss
116337 root 1 -19 0 0 0 S 5.3 0.0 1:18.83 z_wr_iss
117190 root 1 -19 0 0 0 S 5.3 0.0 1:18.87 z_wr_iss
117364 root 1 -19 0 0 0 S 5.3 0.0 1:18.75 z_wr_iss
117486 root 1 -19 0 0 0 S 5.3 0.0 1:18.77 z_wr_iss
117734 root 1 -19 0 0 0 S 5.3 0.0 1:18.92 z_wr_iss
118000 root 1 -19 0 0 0 S 5.3 0.0 1:18.85 z_wr_iss
118176 root 1 -19 0 0 0 S 5.3 0.0 1:18.92 z_wr_iss
118185 root 1 -19 0 0 0 S 5.3 0.0 1:18.89 z_wr_iss
118224 root 1 -19 0 0 0 S 5.3 0.0 1:18.67 z_wr_iss
118250 root 1 -19 0 0 0 S 5.3 0.0 1:19.05 z_wr_iss
118365 root 1 -19 0 0 0 S 5.3 0.0 1:18.87 z_wr_iss
118419 root 1 -19 0 0 0 S 5.3 0.0 1:18.98 z_wr_iss
118551 root 1 -19 0 0 0 S 5.3 0.0 1:18.73 z_wr_iss
118580 root 1 -19 0 0 0 S 5.3 0.0 1:18.99 z_wr_iss
118665 root 1 -19 0 0 0 S 5.3 0.0 1:18.87 z_wr_iss
114642 root 1 -19 0 0 0 S 5.0 0.0 1:18.91 z_wr_iss
117851 root 1 -19 0 0 0 S 5.0 0.0 1:18.82 z_wr_iss
118148 root 1 -19 0 0 0 R 5.0 0.0 1:18.90 z_wr_iss
118211 root 1 -19 0 0 0 S 5.0 0.0 1:18.83 z_wr_iss
Thank you in advance.
Best Regards,
Dennis
Last edited:

")