PVE 100%CPU on all kvm while vms are idle at 0-5% cpu

  • Like
Reactions: naimo
Any system related should have a reboot. Especially any stuff touching io... But to have a stable and working system: disconnect inet , iso install, restore vm : all will do work. a server is not a phone to update every 2min.
I just didn't get to do a reboot yet right after the update, hence I was asking cause it wasn't mentioned after installing. I was a bit confused cause indeed usually with something touching IO a reboot is needed.
I don't see why a fresh install is needed now, seems a bit overkill atm. I know it ain't a phone, lol, weird remark.
Anyways, it works now after installing the update and it runs fine so far.
 
Yes. You need to shutdown+start the guest, live migrate to an updated node or use the Reboot button in the web UI. Reboot inside the guest is not enough. Otherwise, the VM will still be running with the old QEMU binary. You can use qm status <ID> --verbose | grep running-qemu to check the currently running version.
Thanks! I will remember that line to check the status. As said, I just didn't have proper time to do all and was a bit confused the update itself never came up with the note a reboot is needed. Usually it does that. So far after a reboot of the host and guests everything runs fine. Not gonna update to the next updates directly, I will wait a little (unless it is needed beceause of some issue or security leak).
 
Thanks! I will remember that line to check the status. As said, I just didn't have proper time to do all and was a bit confused the update itself never came up with the note a reboot is needed. Usually it does that. So far after a reboot of the host and guests everything runs fine. Not gonna update to the next updates directly, I will wait a little (unless it is needed beceause of some issue or security leak).
A reboot of the host is only necessary (or at least recommended) after kernel upgrades. I described how you can get the VM to use the new QEMU binary which doesn't require a host reboot.
 
  • Like
Reactions: genivos
Hi,

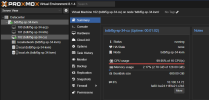
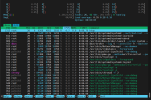
i'm having similar issue with CPU at 75-80%, but downgrading 'pve-qemu-kvm' didn't solve the problem (tested with 8.1.2-4, 8.1.2-6 and actual 8.1.5-3). Maybe this is caused by a different problem,

My problem is appears only with home assistant os, other VMs with debian and ubuntu are working well.

What i have tested:
- Versions 10.5, 11.4, 11.5 and 12.0rc1, always having the same problem.
- Install home assitant os through official media using ubintu live instead of qcow2 OVA.
- Install ubuntu on a new VM and replace the HDD, the Ubuntu system with and without guest agent report the correct CPU, but when i change the HDD to the Home Assistant OS HDD the problem appears, it has guest agent installed.

Thanks in advance :)


Screenshots:


More info:
pveversion -v
proxmox-ve: 8.1.0 (running kernel: 6.5.13-1-pve)
pve-manager: 8.1.4 (running version: 8.1.4/ec5affc9e41f1d79)
proxmox-kernel-helper: 8.1.0
pve-kernel-6.2: 8.0.5
proxmox-kernel-6.5.13-1-pve-signed: 6.5.13-1
proxmox-kernel-6.5: 6.5.13-1
proxmox-kernel-6.5.11-7-pve-signed: 6.5.11-7
proxmox-kernel-6.2.16-20-pve: 6.2.16-20
proxmox-kernel-6.2: 6.2.16-20
proxmox-kernel-6.2.16-14-pve: 6.2.16-14
pve-kernel-6.2.16-3-pve: 6.2.16-3
ceph-fuse: 17.2.7-pve2
corosync: 3.1.7-pve3
criu: 3.17.1-2
glusterfs-client: 10.3-5
ifupdown2: 3.2.0-1+pmx8
ksm-control-daemon: 1.4-1
libjs-extjs: 7.0.0-4
libknet1: 1.28-pve1
libproxmox-acme-perl: 1.5.0
libproxmox-backup-qemu0: 1.4.1
libproxmox-rs-perl: 0.3.3
libpve-access-control: 8.1.1
libpve-apiclient-perl: 3.3.1
libpve-common-perl: 8.1.0
libpve-guest-common-perl: 5.0.6
libpve-http-server-perl: 5.0.5
libpve-network-perl: 0.9.5
libpve-rs-perl: 0.8.8
libpve-storage-perl: 8.0.5
libspice-server1: 0.15.1-1
lvm2: 2.03.16-2
lxc-pve: 5.0.2-4
lxcfs: 5.0.3-pve4
novnc-pve: 1.4.0-3
proxmox-backup-client: 3.1.4-1
proxmox-backup-file-restore: 3.1.4-1
proxmox-kernel-helper: 8.1.0
proxmox-mail-forward: 0.2.3
proxmox-mini-journalreader: 1.4.0
proxmox-widget-toolkit: 4.1.3
pve-cluster: 8.0.5
pve-container: 5.0.8
pve-docs: 8.1.3
pve-edk2-firmware: 4.2023.08-4
pve-firewall: 5.0.3
pve-firmware: 3.9-2
pve-ha-manager: 4.0.3
pve-i18n: 3.2.0
pve-qemu-kvm: 8.1.2-4
pve-xtermjs: 5.3.0-3
qemu-server: 8.0.10
smartmontools: 7.3-pve1
spiceterm: 3.3.0
swtpm: 0.8.0+pve1
vncterm: 1.8.0
zfsutils-linux: 2.2.2-pve2

qm config
agent: 1
bios: ovmf
boot: order=scsi0;ide2;net0
cores: 2
cpu: x86-64-v2-AES
description:
efidisk0: local-lvm:vm-106-disk-0,efitype=4m,size=4M
ide2: none,media=cdrom
memory: 8192
meta: creation-qemu=8.1.2,ctime=1708196366
name: haos
net0: virtio=BC:24:11:FE:11:35,bridge=vmbr0,firewall=1
numa: 0
ostype: l26
scsi0: local-lvm:vm-106-disk-1,size=32G
scsihw: virtio-scsi-single
smbios1: uuid=bdc7ecae-2b7d-44d8-b1a3-e272b9c2ad8f
sockets: 1
usb0: host=2550:8761
vmgenid: 0b30ea13-3b56-45f2-871e-7c1c306c125d

strace
root@pve:~# timeout 10 strace -c -p $(cat /var/run/qemu-server/106.pid)
strace: Process 6408 attached
strace: Process 6408 detached
% time seconds usecs/call calls errors syscall
------ ----------- ----------- --------- --------- ----------------
98.60 2.925277 138 21050 ppoll
0.82 0.024243 7 3197 798 ioctl
0.21 0.006347 3 1980 write
0.16 0.004871 5 973 read
0.09 0.002801 5 483 recvmsg
0.06 0.001898 2 798 poll
0.04 0.001248 1 894 6 futex
0.00 0.000053 13 4 fcntl
0.00 0.000026 2 10 sendmsg
0.00 0.000011 2 5 5 recvfrom
0.00 0.000005 2 2 accept4
0.00 0.000004 2 2 close
0.00 0.000003 0 4 timerfd_settime
0.00 0.000001 0 2 getsockname
------ ----------- ----------- --------- --------- ----------------
100.00 2.966788 100 29404 809 total
 
Hi,
Hi,

i'm having similar issue with CPU at 75-80%, but downgrading 'pve-qemu-kvm' didn't solve the problem (tested with 8.1.2-4, 8.1.2-6 and actual 8.1.5-3). Maybe this is caused by a different problem,

My problem is appears only with home assistant os, other VMs with debian and ubuntu are working well.

What i have tested:
- Versions 10.5, 11.4, 11.5 and 12.0rc1, always having the same problem.
- Install home assitant os through official media using ubintu live instead of qcow2 OVA.
- Install ubuntu on a new VM and replace the HDD, the Ubuntu system with and without guest agent report the correct CPU, but when i change the HDD to the Home Assistant OS HDD the problem appears, it has guest agent installed.

Thanks in advance :)
are you sure the VM is not just actually using this much CPU? How does the usage inside the guest look like? Please use a tool like htop on the host to check which thread of the QEMU process is using the CPU.
 
Hi,

are you sure the VM is not just actually using this much CPU? How does the usage inside the guest look like? Please use a tool like htop on the host to check which thread of the QEMU process is using the CPU.
Hi Fiona,

Thanks for the advice, I tried the TOP command and it showed a consumption of approximately 20% CPU, then I sorted the processes by CPU and the 'coredns' process was consuming close to 100%, I deactivated the process and now everything works correctly.

I leave the information here.

To disable the process:
Bash:
ha dns options --fallback=false

Here they talk about the problem
https://community.home-assistant.io/t/very-high-cpu-usage-for-coredns/421124

Now everything is fine.

Regards.
 
Can you check with e.g. htop which thread is using the CPU? Is iothread enabled on the disk? Does the issue start after you do a backup? Is it also present when you downgrade with apt install pve-qemu-kvm=8.1.2-4 and stop/start the VM (to have it use the now installed QEMU binary)?
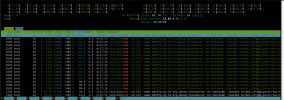
Tried this but it did not solved my problem. Issue still there after installing pve-qemu-kvm=8.1.2-4+reboot. IO thread is also enabled.1710670563661.png
1710670424405.png
 
Hi,
Tried this but it did not solved my problem. Issue still there after installing pve-qemu-kvm=8.1.2-4+reboot. IO thread is also enabled.
please try the latest available version. Just to make sure, you need to reboot via the button in the Web UI? Reboot from inside the guest is not enough to pick up the newly installed version.
Also looks different. The original issue in this thread is about just the IO thread(s) looping with 100%. Do you really have this many disks with IO thread attached? Otherwise those are likely the vCPU threads.

Please share the output of pveversion -v and qm config 102 after upgrading and testing with the latest version. Another thing you might want to check if you have latest BIOS upgrades and CPU microcode installed: https://pve.proxmox.com/pve-docs/chapter-sysadmin.html#sysadmin_firmware_cpu
 
Last edited:
Hi,

please try the latest available version. Just to make sure, you need to reboot via the button in the Web UI? Reboot from inside the guest is not enough to pick up the newly installed version.

Also looks different. The original issue in this thread is about just the IO thread(s) looping with 100%. Do you really have this many disks with IO thread attached? Otherwise those are likely the vCPU threads.

Please share the output of pveversion -v and qm config 102 after upgrading and testing with the latest version. Another thing you might want to check if you have latest BIOS upgrades and CPU microcode installed: https://pve.proxmox.com/pve-docs/chapter-sysadmin.html#sysadmin_firmware_cpu
Hi Fiona,
I have updated the BIOS to the latest release and have installed the CPU microcode following the link you shared. i have also updated the pve to latest version and did a reboot after all this using the proxmox gui buttons.

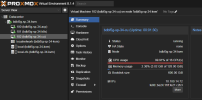
The issue is when i look at my VM on the proxmox gui it shows 100% CPU usage, but when i login to the VM, inside the VM the CPU usage is less than 1%. I'm attaching a fresh snapshot where i show both CPU usage values captured at the same.
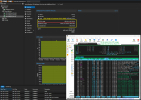

1710764472010.png


Output of given commands:
root@bdbf5g-sp-34-kvm:~# pveversion -v
proxmox-ve: 8.1.0 (running kernel: 6.5.13-1-pve)
pve-manager: 8.1.4 (running version: 8.1.4/ec5affc9e41f1d79)
proxmox-kernel-helper: 8.1.0
proxmox-kernel-6.5.13-1-pve-signed: 6.5.13-1
proxmox-kernel-6.5: 6.5.13-1
proxmox-kernel-6.5.11-8-pve-signed: 6.5.11-8
ceph-fuse: 17.2.7-pve2
corosync: 3.1.7-pve3
criu: 3.17.1-2
glusterfs-client: 10.3-5
ifupdown2: 3.2.0-1+pmx8
ksm-control-daemon: 1.4-1
libjs-extjs: 7.0.0-4
libknet1: 1.28-pve1
libproxmox-acme-perl: 1.5.0
libproxmox-backup-qemu0: 1.4.1
libproxmox-rs-perl: 0.3.3
libpve-access-control: 8.1.2
libpve-apiclient-perl: 3.3.1
libpve-common-perl: 8.1.1
libpve-guest-common-perl: 5.0.6
libpve-http-server-perl: 5.0.5
libpve-network-perl: 0.9.5
libpve-rs-perl: 0.8.8
libpve-storage-perl: 8.1.0
libspice-server1: 0.15.1-1
lvm2: 2.03.16-2
lxc-pve: 5.0.2-4
lxcfs: 5.0.3-pve4
novnc-pve: 1.4.0-3
proxmox-backup-client: 3.1.4-1
proxmox-backup-file-restore: 3.1.4-1
proxmox-kernel-helper: 8.1.0
proxmox-mail-forward: 0.2.3
proxmox-mini-journalreader: 1.4.0
proxmox-offline-mirror-helper: 0.6.5
proxmox-widget-toolkit: 4.1.4
pve-cluster: 8.0.5
pve-container: 5.0.8
pve-docs: 8.1.4
pve-edk2-firmware: 4.2023.08-4
pve-firewall: 5.0.3
pve-firmware: 3.9-2
pve-ha-manager: 4.0.3
pve-i18n: 3.2.1
pve-qemu-kvm: 8.1.5-3
pve-xtermjs: 5.3.0-3
qemu-server: 8.0.10
smartmontools: 7.3-pve1
spiceterm: 3.3.0
swtpm: 0.8.0+pve1
vncterm: 1.8.0
zfsutils-linux: 2.2.2-pve2

root@bdbf5g-sp-34-kvm:~# qm config 102
agent: 1
balloon: 0
boot: order=scsi0;ide2;net0
cores: 16
cpu: host
ide2: local:iso/Rocky-9.1-x86_64-minimal.iso,media=cdrom,size=1555264K
memory: 131072
meta: creation-qemu=8.1.5,ctime=1710449085
name: bdbf5g-sp-34-cu
net0: virtio=BC:24:11:21:C2:B3,bridge=vmbr0,firewall=1
net1: virtio=BC:24:11:2D:6D:D7,bridge=vmbr1,firewall=1
net2: virtio=BC:24:11:D2:B7:27,bridge=vmbr2,firewall=1
net3: virtio=BC:24:11:9C:21:35,bridge=vmbr3,firewall=1
numa: 0
onboot: 1
ostype: l26
scsi0: local-zfs:vm-102-disk-0,iothread=1,size=600G
scsihw: virtio-scsi-single
smbios1: uuid=fe3f4063-1d86-4213-9764-e4481b5e4d1a
sockets: 1
vmgenid: 7478bb4d-0160-448e-a223-3057491ac322
root@bdbf5g-sp-34-kvm:~#
 
The load in the screenshot is 2.31 (out of 16 possible), so much more than 1%. But still not the full 16 out of 16 you would expect from the outside. What does for i in {1..5}; do cat /proc/stat | head -1 && sleep 1; done inside the VM show while the issue is happening?

You can use apt install pve-qemu-kvm-dbgsym gdb to install the relevant debug symbols and debugger. Then you can obtain a backtrace with gdb --batch --ex 't a a bt' -p $(cat /var/run/qemu-server/102.pid) &> /tmp/bt-102.txt. Please share the resulting file, which might contain hints what the QEMU threads are actually doing.

What physical CPU do you have? Does the issue also happens with the x86-64-v2-AES CPU model rather than host?
Hi Fiona,

I tried changing the CPU model in VM>Hardware to x86-64-v2-AES but that also did not solved the problem.
The host machine has 2xIntel(R) Xeon(R) Gold 6230 CPU @ 2.10GHz CPU with SMT disabled.

Please find output as requested.

[root@bdbf5g-sp-34-cu ~]# for i in {1..5}; do cat /proc/stat | head -1 && sleep 1; done
cpu 47027 266 33879 44822651 116 115085 1526 323 0 0
cpu 47027 266 33879 44824251 116 115089 1526 323 0 0
cpu 47027 266 33880 44825850 116 115093 1526 323 0 0
cpu 47027 266 33880 44827450 116 115097 1526 323 0 0
cpu 47029 266 33882 44829047 116 115101 1526 323 0 0
 

Attachments

  • bt-102.txt
    19.2 KB · Views: 1
Hi Fiona,

I tried changing the CPU model in VM>Hardware to x86-64-v2-AES but that also did not solved the problem.
The host machine has 2xIntel(R) Xeon(R) Gold 6230 CPU @ 2.10GHz CPU with SMT disabled.

Please find output as requested.

[root@bdbf5g-sp-34-cu ~]# for i in {1..5}; do cat /proc/stat | head -1 && sleep 1; done
cpu 47027 266 33879 44822651 116 115085 1526 323 0 0
cpu 47027 266 33879 44824251 116 115089 1526 323 0 0
cpu 47027 266 33880 44825850 116 115093 1526 323 0 0
cpu 47027 266 33880 44827450 116 115097 1526 323 0 0
cpu 47029 266 33882 44829047 116 115101 1526 323 0 0
The fourth value is idle time, and almost all of the time is spent there. In the backtrace nothing stands out either unfortunately.

Please check the system logs/journal for any interesting messages. Did the issue start happening recently or is this a new installation? If the former, can you correlate it with a certain update?

And just to be sure: did you reboot the host after installing the microcode package?
Hi Fiona,
Yes i rebooted the host server using the reboot option from the Proxmox GUI. Its a new installation. I never observed such an issue with the previous versions of Proxmox. This VM is running RockOS 9.1. I hope RockyOS 9.1 is supported by Proxmox? Right?
 
Hi Fiona,
Yes i rebooted the host server using the reboot option from the Proxmox GUI. Its a new installation. I never observed such an issue with the previous versions of Proxmox. This VM is running RockOS 9.1. I hope RockyOS 9.1 is supported by Proxmox? Right?
Yes, all common Linux distros should work as guests. I installed it locally, but no issues on my machine. Were the previous installations on the same hardware?

The VM has 4 vNICs. Is there substantial traffic happening there? How many cores/RAM do the other VMs have? Does the issue also happen if just this VM is running?

Just guessing, but what you could try to see if it makes a difference:
  • reduce the amount of RAM the VM has (128 GiB is quite a lot and if not actually needed, will just have QEMU/KVM need to do more bookkeeping)
  • enable ballooning
  • reduce the amount of cores
  • enable SMT
  • disable KVM hardware virtualization in the VM's Options tab (just to see if it's related to that)
Hi Fiona,
The other VMs have 8cores/64GB RAM. They seem to be running fine.
Yes the VM has 4 interfaces so that 4 different networks can reach this VM. It needs to be used as a CU component of an Open RAN system which requires 4 interfaces. I have used Proxmox to deploy this very set of 3 VMs in many previous versions but did not faced this issue.

Yes, tried reducing RAM to 64GB. No luck.
Enabled ballooning, disabled ballooning. No luck.
The application we want to deploy in this VM requires atleast 16 cores.
The application we want to deploy in this VM recommends SMT disabled on the host machine.
Tried disabling KVM hardware virtualization, the VM doesn't even boot.

I have reached out to our CU vendor as well to see if they can find out anything unusual on their side.
Will post if i find anything further.
 
I have used Proxmox to deploy this very set of 3 VMs in many previous versions but did not faced this issue.
Was that on the same/similar hardware? What Proxmox version?

You could still try downgrading the QEMU package pve-qemu-kvm and/or booting into an older kernel to see if it's a regression in one of them.
 

About

The Proxmox community has been around for many years and offers help and support for Proxmox VE, Proxmox Backup Server, and Proxmox Mail Gateway.
We think our community is one of the best thanks to people like you!

Get your subscription!

The Proxmox team works very hard to make sure you are running the best software and getting stable updates and security enhancements, as well as quick enterprise support. Tens of thousands of happy customers have a Proxmox subscription. Get yours easily in our online shop.

Buy now!