Hi,
Weird thing happened on my Proxmox server (8.2.7) hosted with OVH. I was noticing that connections to both the Proxmox server itself (as well as any VMs on virtual IPs behind my pfSense acted like they had network congestion). I eventually lost the ability to even SSH or HTTPs into Proxmox, so I went to the virtual KVM with the provider and saw that Proxmox was at the regular boot screen. When I typed in "root" and hit enter, I was never prompted for a password. The cursor would just blink and then eventually I'd get a timeout message as if I didn't type the password in quick enough. I tried a few more times but eventually the server just acted like it was fully locked up.
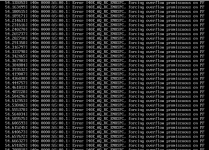
I issued a reset through the IPMI interface. The server came up with several pages of this:

But then it did show the regular "Welcome to proxmox" message. I'm now back in the GUI and starting up VMs and things all seem to be coming up fine.
My question: do you have any suggestions on things I might do/check to figure out why this happened in the first places? All services were fully up and operational without issue all day today, and I didn't make any Proxmox, VM or firewall upgrades. It was just "business as usual" until...well, it wasn't :-(
Thanks!
Weird thing happened on my Proxmox server (8.2.7) hosted with OVH. I was noticing that connections to both the Proxmox server itself (as well as any VMs on virtual IPs behind my pfSense acted like they had network congestion). I eventually lost the ability to even SSH or HTTPs into Proxmox, so I went to the virtual KVM with the provider and saw that Proxmox was at the regular boot screen. When I typed in "root" and hit enter, I was never prompted for a password. The cursor would just blink and then eventually I'd get a timeout message as if I didn't type the password in quick enough. I tried a few more times but eventually the server just acted like it was fully locked up.
I issued a reset through the IPMI interface. The server came up with several pages of this:

But then it did show the regular "Welcome to proxmox" message. I'm now back in the GUI and starting up VMs and things all seem to be coming up fine.
My question: do you have any suggestions on things I might do/check to figure out why this happened in the first places? All services were fully up and operational without issue all day today, and I didn't make any Proxmox, VM or firewall upgrades. It was just "business as usual" until...well, it wasn't :-(
Thanks!


