Hey Proxmox community.
At our company we are testing Proxmox as hypervisor. We are currently using ESXi but are at a crossroad to either upgrade or fine something new.
So, I have brought a HPE DL380 Gen10 to run some test on Proxmox to make sure our production environment would run as expected before migrating.
Server setup CPU Gold 6248 - OS 2x 240GB HPE SAS SSD in raid 1 - 6x 32GB Memory - 6x 600GB HPE SAS SSD in raid 5 for storage.
My VMs have been imported directly from ESXi which was a smooth process. VMs have been tested both with VMtools installed and where I removed it before import.
Proxmox currently running 8.4.16 (started with 9.1.x but rolled back)
Each VM has been modified to use VirtIO SCSI single as controller and disks as SCSI, Discard enabled, IO thread enabled, SSD emulation enabled, AIO as io_uring Cache tested as Default/Write back/Write through.
QEMU Agent enabled and installed v.0.1.285 (also tested with 0.1.271)
My issue is if I'm on VM1 and trying to access data from my Historian VM. I'm getting so slow and poor IO that its often times out. This issue isn't there on ESXi, so expecting it to be a Proxmox issue.
According to ChatGPT my issue should relate to ESXi is finetuned by default and Promox needs some tweaking to hit same performance. ChatGPT advise is following:
Use Raid10 and not Raid5 (tried on a secondary server with raid 10 and it felt as same performance).
Controller cache set to Write Back + Read Cache ON - tried no different.
Data storage as LVM-thin and now LVM (thick). Seems to have similar performance.
Tried to modify blockdev to 4096.
Changed raid controller from 95% write & 5% read to 75% read & 25% write but can't see much different.
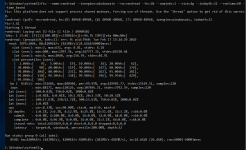
fio --name=fiotest --filename=/home/test1 --size=16Gb --rw=randread
--bs=8K --direct=1 --numjobs=8 --ioengine=libaio --iodepth=32 --group_reporting --runtim
e=60 --startdelay=60
fiotest: (g=0): rw=randread, bs=(R) 8192B-8192B, (W) 8192B-8192B, (T) 8192B-8192B, ioengine=libaio, iodepth=32
...
fio-3.33
Starting 8 processes
Jobs: 8 (f=8): [r(8)][100.0%][r=499MiB/s][r=63.9k IOPS][eta 00m:00s]
fiotest: (groupid=0, jobs=8): err= 0: pid=2264789: Tue Feb 17 12:21:45 2026
read: IOPS=63.9k, BW=499MiB/s (523MB/s)(29.3GiB/60008msec)
slat (usec): min=2, max=5278, avg= 7.87, stdev=11.29
clat (usec): min=71, max=20000, avg=3997.96, stdev=3747.52
lat (usec): min=85, max=20028, avg=4005.83, stdev=3747.56
clat percentiles (usec):
| 1.00th=[ 141], 5.00th=[ 178], 10.00th=[ 206], 20.00th=[ 258],
| 30.00th=[ 310], 40.00th=[ 396], 50.00th=[ 2802], 60.00th=[ 6915],
| 70.00th=[ 7439], 80.00th=[ 7898], 90.00th=[ 8455], 95.00th=[ 8848],
| 99.00th=[ 9765], 99.50th=[10159], 99.90th=[11338], 99.95th=[12387],
| 99.99th=[14615]
bw ( KiB/s): min=487216, max=538400, per=100.00%, avg=511565.18, stdev=1195.12, samples=952
iops : min=60902, max=67300, avg=63945.63, stdev=149.39, samples=952
lat (usec) : 100=0.04%, 250=18.30%, 500=27.69%, 750=3.53%, 1000=0.37%
lat (msec) : 2=0.06%, 4=0.01%, 10=49.40%, 20=0.60%, 50=0.01%
cpu : usr=1.89%, sys=8.45%, ctx=3526050, majf=0, minf=599
IO depths : 1=0.1%, 2=0.1%, 4=0.1%, 8=0.1%, 16=0.1%, 32=100.0%, >=64=0.0%
submit : 0=0.0%, 4=100.0%, 8=0.0%, 16=0.0%, 32=0.0%, 64=0.0%, >=64=0.0%
complete : 0=0.0%, 4=100.0%, 8=0.0%, 16=0.0%, 32=0.1%, 64=0.0%, >=64=0.0%
issued rwts: total=3834019,0,0,0 short=0,0,0,0 dropped=0,0,0,0
latency : target=0, window=0, percentile=100.00%, depth=32
Run status group 0 (all jobs):
READ: bw=499MiB/s (523MB/s), 499MiB/s-499MiB/s (523MB/s-523MB/s), io=29.3GiB (31.4GB), run=60008-60008msec
Disk stats (read/write):
dm-1: ios=3821452/366, merge=0/0, ticks=15269891/3007, in_queue=15272898, util=99.91%, aggrios=3834067/293, aggrmerge=0/74, aggrticks=15326719/2109, aggrin_queue=15328827, aggrutil=72.56%
sda: ios=3834067/293, merge=0/74, ticks=15326719/2109, in_queue=15328827, util=72.56%
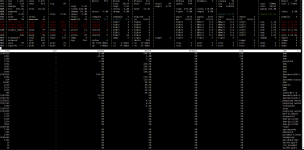
Atop -d from when I'm trying to access data on my historian 106--disk---2

Also, would support be able to assist I where to purchase a support agreement or is this out of their scope?
At our company we are testing Proxmox as hypervisor. We are currently using ESXi but are at a crossroad to either upgrade or fine something new.
So, I have brought a HPE DL380 Gen10 to run some test on Proxmox to make sure our production environment would run as expected before migrating.
Server setup CPU Gold 6248 - OS 2x 240GB HPE SAS SSD in raid 1 - 6x 32GB Memory - 6x 600GB HPE SAS SSD in raid 5 for storage.
My VMs have been imported directly from ESXi which was a smooth process. VMs have been tested both with VMtools installed and where I removed it before import.
Proxmox currently running 8.4.16 (started with 9.1.x but rolled back)
Each VM has been modified to use VirtIO SCSI single as controller and disks as SCSI, Discard enabled, IO thread enabled, SSD emulation enabled, AIO as io_uring Cache tested as Default/Write back/Write through.
QEMU Agent enabled and installed v.0.1.285 (also tested with 0.1.271)
My issue is if I'm on VM1 and trying to access data from my Historian VM. I'm getting so slow and poor IO that its often times out. This issue isn't there on ESXi, so expecting it to be a Proxmox issue.
According to ChatGPT my issue should relate to ESXi is finetuned by default and Promox needs some tweaking to hit same performance. ChatGPT advise is following:
Use Raid10 and not Raid5 (tried on a secondary server with raid 10 and it felt as same performance).
Controller cache set to Write Back + Read Cache ON - tried no different.
Data storage as LVM-thin and now LVM (thick). Seems to have similar performance.
Tried to modify blockdev to 4096.
Changed raid controller from 95% write & 5% read to 75% read & 25% write but can't see much different.
fio --name=fiotest --filename=/home/test1 --size=16Gb --rw=randread
--bs=8K --direct=1 --numjobs=8 --ioengine=libaio --iodepth=32 --group_reporting --runtim
e=60 --startdelay=60
fiotest: (g=0): rw=randread, bs=(R) 8192B-8192B, (W) 8192B-8192B, (T) 8192B-8192B, ioengine=libaio, iodepth=32
...
fio-3.33
Starting 8 processes
Jobs: 8 (f=8): [r(8)][100.0%][r=499MiB/s][r=63.9k IOPS][eta 00m:00s]
fiotest: (groupid=0, jobs=8): err= 0: pid=2264789: Tue Feb 17 12:21:45 2026
read: IOPS=63.9k, BW=499MiB/s (523MB/s)(29.3GiB/60008msec)
slat (usec): min=2, max=5278, avg= 7.87, stdev=11.29
clat (usec): min=71, max=20000, avg=3997.96, stdev=3747.52
lat (usec): min=85, max=20028, avg=4005.83, stdev=3747.56
clat percentiles (usec):
| 1.00th=[ 141], 5.00th=[ 178], 10.00th=[ 206], 20.00th=[ 258],
| 30.00th=[ 310], 40.00th=[ 396], 50.00th=[ 2802], 60.00th=[ 6915],
| 70.00th=[ 7439], 80.00th=[ 7898], 90.00th=[ 8455], 95.00th=[ 8848],
| 99.00th=[ 9765], 99.50th=[10159], 99.90th=[11338], 99.95th=[12387],
| 99.99th=[14615]
bw ( KiB/s): min=487216, max=538400, per=100.00%, avg=511565.18, stdev=1195.12, samples=952
iops : min=60902, max=67300, avg=63945.63, stdev=149.39, samples=952
lat (usec) : 100=0.04%, 250=18.30%, 500=27.69%, 750=3.53%, 1000=0.37%
lat (msec) : 2=0.06%, 4=0.01%, 10=49.40%, 20=0.60%, 50=0.01%
cpu : usr=1.89%, sys=8.45%, ctx=3526050, majf=0, minf=599
IO depths : 1=0.1%, 2=0.1%, 4=0.1%, 8=0.1%, 16=0.1%, 32=100.0%, >=64=0.0%
submit : 0=0.0%, 4=100.0%, 8=0.0%, 16=0.0%, 32=0.0%, 64=0.0%, >=64=0.0%
complete : 0=0.0%, 4=100.0%, 8=0.0%, 16=0.0%, 32=0.1%, 64=0.0%, >=64=0.0%
issued rwts: total=3834019,0,0,0 short=0,0,0,0 dropped=0,0,0,0
latency : target=0, window=0, percentile=100.00%, depth=32
Run status group 0 (all jobs):
READ: bw=499MiB/s (523MB/s), 499MiB/s-499MiB/s (523MB/s-523MB/s), io=29.3GiB (31.4GB), run=60008-60008msec
Disk stats (read/write):
dm-1: ios=3821452/366, merge=0/0, ticks=15269891/3007, in_queue=15272898, util=99.91%, aggrios=3834067/293, aggrmerge=0/74, aggrticks=15326719/2109, aggrin_queue=15328827, aggrutil=72.56%
sda: ios=3834067/293, merge=0/74, ticks=15326719/2109, in_queue=15328827, util=72.56%
Atop -d from when I'm trying to access data on my historian 106--disk---2

Also, would support be able to assist I where to purchase a support agreement or is this out of their scope?


