Hi,
Total Proxmox and virtualisation noob here. I've spent a good day on this and haven't got far so I'm hoping that the cause of the slow transfer speeds and hanging will be obvious to the amazing experts on this forum.
I've got Promox running on the below hardware and I'm running into a situation where VMs are hanging during large file transfers.
Due to a quirk of the Gen8 unit, I've had to put each individual disk in RAID0 in BIOS in order to be able to boot from the internal SATA port – this is effectively JBOD in a 1x1 configuration. From there, each disk is combined into a RAID10 pool – so 2x2 mirror – within Proxmox.
Inside Proxmox I have a OpenMediaVault VM that I've added a 6TB EXT4 virtual disk to (write back is off).
Inside OMV I've setup an SMB server and shared a folder on that virtual disk.
When transferring files from macOS to the SMB share using rsync, the speed fluctuates from 25MB/s to 0.4MB/s, and has hung at times.
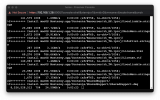
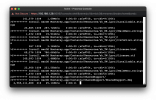
OMV shell output during hang
Things I've tried
qm config output for OMV VM
zpool isostat & pvesm status output during transfer
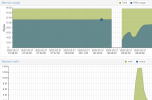
Proxmox node & vm summaries attached. FYI, once I stopped the other VMs the memory wasn't maxxed out anymore.


Total Proxmox and virtualisation noob here. I've spent a good day on this and haven't got far so I'm hoping that the cause of the slow transfer speeds and hanging will be obvious to the amazing experts on this forum.
I've got Promox running on the below hardware and I'm running into a situation where VMs are hanging during large file transfers.
HPe Gen8 MicroServer | 16Gb (2x8Gb) HP 669239-581 DDR3 ECC Unbuffered RAM 1600Mhz | Intel Xeon E3-1265L V2 @ 2.5GHz 4/4 cores; 8 threads | WD 500GB 2.5” Blue for Proxmox | 4x WD Red Plus 3.5" 4TB SATA Internal Hard Drive HDD 128MB WD40EFZX
Due to a quirk of the Gen8 unit, I've had to put each individual disk in RAID0 in BIOS in order to be able to boot from the internal SATA port – this is effectively JBOD in a 1x1 configuration. From there, each disk is combined into a RAID10 pool – so 2x2 mirror – within Proxmox.
Inside Proxmox I have a OpenMediaVault VM that I've added a 6TB EXT4 virtual disk to (write back is off).
Inside OMV I've setup an SMB server and shared a folder on that virtual disk.
When transferring files from macOS to the SMB share using rsync, the speed fluctuates from 25MB/s to 0.4MB/s, and has hung at times.
OMV shell output during hang
Code:
openmediavault login: [ 483.877155] INFO: task kworker/u4:2:119 blocked for more than 120 seconds
483.877226]
Not tainted 5.10.0-0.bpo.8-amd64 #1 Debian 5.10.46-4 bpo10+1
483.877262]
"echo 0 > /proc/sys/kernel/hung_task_timeout_secs"
disables this message
483.877642] INFO: task jbd2/sda1-8:185 blocked for more than 120 seconds
483.877678]
Not tainted 5.10.0-0.bo.8-amd64 #1 Debian 5.10.46-4^b0010+1
483.877713]
"echo o > /proc/sys/kernel/hung task timeout secs"
disables this message.
483.877860] INFO: task jbd2/sdb1-8:347 blocked for more than 120 seconds.
483.8778951
Not tainted 5.10.0-0.boo.8-amd64 #1 Debian 5.10.46-4^b0010+1
483.877930]
"echo 0 > /proc/sys/kernel/hung_task_timeout_secs"
disables this message.
Things I've tried
- Updating everything – ROM, iLO, Proxmox, OMV, macOS client
- Editing
/etc/sysctl.confto include changes mentioned in this post. Doing so stopping the VM from hanging but hasn't improved transfer speeds. - Giving the VM more memory (4GB) and more cores (4), stopping all other running VMs. This hasn't improved things.
- Setting the NIC to 4000 MTU in Proxmox. Has not improved anything.
- Trying each of the virtual NIC models assigned to the VM
qm config output for OMV VM
Code:
root@home:/# qm config 102
balloon: 768
boot: order=scsi0;net0
cores: 2
memory: 2048
meta: creation-qemu=6.1.0,ctime=1645272469
name: home-openmediavault
net0: virtio=B6:27:68:EA:A3:B0,bridge=vmbr0
numa: 0
onboot: 1
ostype: l26
scsi0: A1:vm-102-disk-0,size=50G
scsi1: A1:vm-102-disk-1,size=6000G
scsihw: virtio-scsi-pci
smbios1: uuid=a7f827f8-04ed-4184-9e9f-c3b632f9fdec
sockets: 1
vmgenid: 3b711603-34e7-4fe7-9031-cad89027da72
zpool isostat & pvesm status output during transfer
Code:
root@home:/# zpool iostat 1
              capacity     operations     bandwidth
pool        alloc   free   read  write   read  write
----------  -----  -----  -----  -----  -----  -----
A1          46.3G  7.20T    187    147  6.90M  9.91M
A1          46.3G  7.20T      0    277  7.99K  32.1M
A1          46.3G  7.20T     22    235   144K  25.1M
A1          46.3G  7.20T      1    267  12.0K  28.9M
A1          46.3G  7.20T      1    295  15.9K  28.6M
A1          46.3G  7.20T     22    217   140K  21.2M
A1          46.3G  7.20T     36    213   187K  20.7M
A1          46.3G  7.20T      0    265      0  27.0M
A1          46.3G  7.20T     11    272  63.9K  28.3M
A1          46.3G  7.20T      1    259  16.0K  23.6M
A1          46.3G  7.20T      0    281  7.98K  27.4M
A1          46.3G  7.20T      2    214  23.9K  16.2M
A1          46.3G  7.20T      1    238  15.9K  21.2M
A1          46.4G  7.20T      0    256  7.98K  29.8M
A1          46.4G  7.20T      1    416  16.0K  51.2M
A1          46.4G  7.20T      1    328  12.0K  39.1M
A1          46.4G  7.20T      1    376  16.0K  45.1M
A1          46.4G  7.20T      0    319  7.98K  38.1M
A1          46.4G  7.20T      0    334  7.99K  40.3M
A1          46.4G  7.20T      1    289  15.9K  34.2M
A1          46.4G  7.20T     22    297   144K  35.4M
              capacity     operations     bandwidth
pool        alloc   free   read  write   read  write
----------  -----  -----  -----  -----  -----  -----
A1          46.4G  7.20T      1    289  11.3K  25.1M
A1          46.4G  7.20T     14    210  99.8K  14.8M
A1          46.4G  7.20T      0    244  39.9K  18.5M
A1          46.4G  7.20T      0    244  7.98K  20.8M
A1          46.4G  7.20T      3    228  27.9K  15.7M
A1          46.4G  7.20T      2    179  23.9K  13.2M
A1          46.4G  7.20T      0    211      0  17.2M
A1          46.4G  7.20T     28    282   132K  16.0M
A1          46.4G  7.20T      6    174  39.9K  12.8M
A1          46.4G  7.20T     13    236  55.9K  15.2M
A1          46.4G  7.20T     22    185   112K  12.8M
A1          46.4G  7.20T      0    199      0  15.0M
A1          46.4G  7.20T     45    160   315K  12.6M
A1          46.4G  7.20T     33    150   211K  14.6M
A1          46.4G  7.20T     24    129   144K  76.8M
A1          46.4G  7.20T     25    157   147K  83.2M
A1          46.4G  7.20T     18    140  83.9K  87.1M
A1          46.4G  7.20T     18    152   152K  71.2M
A1          46.4G  7.20T      5    131  24.0K  56.5M
A1          46.4G  7.20T      0    155      0  82.3M
A1          46.4G  7.20T      0    181      0  86.5M
A1          46.4G  7.20T      5    149  47.9K   106M
              capacity     operations     bandwidth
pool        alloc   free   read  write   read  write
----------  -----  -----  -----  -----  -----  -----
A1          46.4G  7.20T      0    149  7.98K  92.3M
A1          46.4G  7.20T     46     82   311K  37.7M
A1          46.4G  7.20T      2     87  15.9K  32.3M
A1          46.4G  7.20T     15    213   128K  34.1M
A1          46.4G  7.20T     28    191   187K  13.9M
A1          46.4G  7.20T     28    172   164K  14.0M
A1          46.4G  7.20T     31    173   152K  14.0M
A1          46.4G  7.20T     29    213   164K  14.6M
A1          46.4G  7.20T     35    209   287K  15.5M
A1          46.4G  7.20T     47    217   288K  14.4M
A1          46.4G  7.20T     20    183   108K  15.0M
A1          46.4G  7.20T     85    156   666K  12.9M
A1          46.4G  7.20T     20    145   152K  7.92M
A1          46.4G  7.20T      0    305      0  19.8M
A1          46.4G  7.20T     15    154   112K  12.0M
A1          46.4G  7.20T      0    225      0  19.6M
A1          46.4G  7.20T      0    240  39.9K  18.2M
A1          46.4G  7.20T      0    214      0  16.3M
A1          46.4G  7.20T      0    198      0  17.8M
A1          46.4G  7.20T      0    184      0  14.3M
A1          46.4G  7.20T      0    232      0  18.6M
A1          46.4G  7.20T      7    194  31.9K  15.6M
              capacity     operations     bandwidth
pool        alloc   free   read  write   read  write
----------  -----  -----  -----  -----  -----  -----
A1          46.4G  7.20T      0    239      0  19.0M
A1          46.4G  7.20T      0    261      0  17.5M
A1          46.4G  7.20T      0    222      0  16.7M
A1          46.4G  7.20T      0    205      0  16.1M
A1          46.4G  7.20T      0    222      0  17.2M
A1          46.4G  7.20T      0    230      0  19.6M
A1          46.4G  7.20T      0    238      0  18.1M
A1          46.4G  7.20T      0    193      0  15.7M
A1          46.4G  7.20T      0    279      0  19.5M
A1          46.4G  7.20T      0    321      0  20.9M
A1          46.4G  7.20T      0    217      0  18.0M
A1          46.4G  7.20T      0    273      0  20.6M
A1          46.4G  7.20T      0    258      0  20.3M
A1          46.4G  7.20T      0    215      0  18.3M
A1          46.4G  7.20T      0    253      0  19.8M
A1          46.4G  7.20T      0    246      0  16.9M
A1          46.4G  7.20T      0    195      0  15.8M
A1          46.4G  7.20T      0    241      0  19.0M
A1          46.4G  7.20T      0    201      0  15.9M
A1          46.4G  7.20T      0    235      0  17.5M
A1          46.4G  7.20T      0    243      0  18.7M
A1          46.4G  7.20T      0    267      0  20.5M
              capacity     operations     bandwidth
pool        alloc   free   read  write   read  write
----------  -----  -----  -----  -----  -----  -----
A1          46.4G  7.20T      0    223      0  17.6M
A1          46.4G  7.20T      0    236      0  18.7M
A1          46.4G  7.20T      0    232      0  17.9M
A1          46.4G  7.20T      0    262      0  19.8M
A1          46.4G  7.20T      0    229      0  18.3M
A1          46.4G  7.20T      0    232      0  18.0M
A1          46.4G  7.20T      0    275      0  23.7M
A1          46.4G  7.20T      0    250      0  22.6M
A1          46.4G  7.20T      0    298      0  21.0M
A1          46.4G  7.20T      0    221      0  18.4M
A1          46.4G  7.20T      0    253      0  17.3M
A1          46.4G  7.20T      0    279      0  19.7M
A1          46.4G  7.20T      0    339      0  23.4M
^C
root@home:/# pvesm status
Name                   Type     Status           Total            Used       Available        %
A1                  zfspool     active      7650410496      6650494780       999915716   86.93%
local                   dir     active        98497780         2881776        90566456    2.93%
local-lvm           lvmthin     active       338591744               0       338591744    0.00%
network-proxmox         nfs     active       239363072       228532224        10830848   95.48%
root@home:/# pvesm status
Name                   Type     Status           Total            Used       Available        %
A1                  zfspool     active      7650410496      6650494780       999915716   86.93%
local                   dir     active        98497780         2881784        90566448    2.93%
local-lvm           lvmthin     active       338591744               0       338591744    0.00%
network-proxmox         nfs     active       239363072       228531200        10831872   95.47%
root@home:/# pvesm status
Name                   Type     Status           Total            Used       Available        %
A1                  zfspool     active      7650410496      6650494780       999915716   86.93%
local                   dir     active        98497780         2881800        90566432    2.93%
local-lvm           lvmthin     active       338591744               0       338591744    0.00%
network-proxmox         nfs     active       239363072       228534272        10828800   95.48%
root@home:/# zpool iostat 10
              capacity     operations     bandwidth
pool        alloc   free   read  write   read  write
----------  -----  -----  -----  -----  -----  -----
A1          46.4G  7.20T    165    158  6.03M  10.7M
A1          46.4G  7.20T      3    250  28.4K  3.59M
A1          46.4G  7.20T      0    266      0  8.83M
A1          46.4G  7.20T      0    278      0  9.66M
A1          46.4G  7.20T      0    234  4.80K  2.96M
A1          46.4G  7.20T      0    236      0  2.55M
A1          46.4G  7.20T      0    214      0  2.45M
A1          46.4G  7.20T      0    274    409  3.67M
A1          46.4G  7.20T      0    285  3.20K  3.23M
A1          46.4G  7.20T      0    255      0  3.04M
A1          46.4G  7.20T      0    284      0  4.06M
A1          46.4G  7.20T      0    295      0  4.01M
A1          46.4G  7.20T      0    200  5.20K  2.98M
A1          46.4G  7.20T      0    285      0  5.77M
A1          46.4G  7.20T      0    229      0  18.6M
A1          46.4G  7.20T      0    297      0  4.30M
A1          46.4G  7.20T      4    288  70.4K  3.40M
A1          46.4G  7.20T     24    209   190K  2.33M
A1          46.4G  7.20T     17    261   146K  5.13M
A1          46.4G  7.20T      0    228      0  17.9M
A1          46.4G  7.20T      0    266      0  14.4M
              capacity     operations     bandwidth
pool        alloc   free   read  write   read  write
----------  -----  -----  -----  -----  -----  -----
A1          46.4G  7.20T      0    239      0  2.85M
A1          46.4G  7.20T      0    249      0  3.69M
A1          46.4G  7.20T      0    294  3.20K  4.66M
A1          46.4G  7.20T      0    300      0  3.64M
A1          47.4G  7.20T      0    250      0  3.56M
A1          47.4G  7.20T      0    215      0  3.24M
A1          47.4G  7.20T      0    287  2.00K  4.07M
A1          47.4G  7.20T      0    300  5.60K  4.46M
A1          47.4G  7.20T      0    303      0  4.28M
A1          47.4G  7.20T      0    252    819  5.86M
A1          47.4G  7.20T      0    211  1.60K  36.2M
A1          47.4G  7.20T     10    265  84.0K  25.4M
A1          47.4G  7.20T      0    259      0  20.3M
A1          47.4G  7.20T      0    318  4.00K  16.7M
A1          47.4G  7.20T      0    318  1.20K  4.92M
A1          47.4G  7.20T      0    301      0  4.14M
A1          47.4G  7.20T      0    272      0  3.95M
A1          47.4G  7.20T      0    247    818  14.3M
A1          47.4G  7.20T      0    252      0  20.1M
A1          47.4G  7.20T      0    302      0  6.95M
A1          47.4G  7.20T      0    291      0  2.80M
A1          47.4G  7.20T      0    265      0  3.57M
              capacity     operations     bandwidth
pool        alloc   free   read  write   read  write
----------  -----  -----  -----  -----  -----  -----
A1          47.4G  7.20T      5    258   157K  3.90M
A1          47.4G  7.20T      5    229  22.4K  2.80M
A1          47.4G  7.20T     13    250  72.8K  15.5M
A1          47.4G  7.20T      0    257      0  18.6M
A1          47.4G  7.20T      0    262      0  6.84M
A1          47.4G  7.20T      0    290      0  4.67M
A1          47.4G  7.20T      0    271  4.00K  3.66M
A1          47.4G  7.20T      0    246      0  5.30M
A1          47.4G  7.20T      0    266  1.60K  4.82M
A1          47.4G  7.20T      0    269  1.20K  7.69M
A1          47.4G  7.20T      0    264      0  25.9M
A1          47.4G  7.20T      0    234  1.60K  3.47M
A1          47.4G  7.20T      2    256  19.6K  4.00M
A1          47.4G  7.20T      3    334  17.6K  3.87M
Proxmox node & vm summaries attached. FYI, once I stopped the other VMs the memory wasn't maxxed out anymore.


Last edited:


