Very slow ethernet Speed on Proxmox Host (tested by speedtest-cli and wget)

DerGast

New Member
Aug 4, 2024
2
0
1
Hi at all!
I've installed an configured a new tiny Proxmox Server for Homeuse only.

8 x AMD Ryzen 5 2400GE with Radeon Vega Graphics
8GB RAM
512GB SSD
1x Gigabit LAN

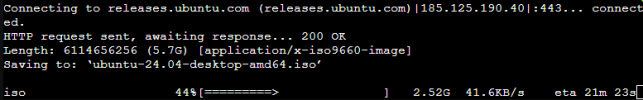
I have a very poor performance when i download some ISO-FIles from public Servers.
For example Ubuntu Server ISO.

With my connected Notebook (same Switch) i've a speed 6.8MB/s-7.0 MB/s (50 MBit Connection)

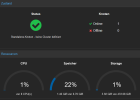
With the Proxmox Server i've a speed...terrible:
speedtest-cli
Testing from Deutsche Telekom AG (93.209.140.245)...
Testing download speed..
Download: 0.27 Mbit/s
Testing upload speed....
Upload: 1.80 Mbit/s

Any ideas?

There is no runnig VM, and it's only one Ethernet Interface with internal IPs (without vlan) an direct Gateway to my Router.

Kind regards!
Dan


1722785624946.png
 
Try running these commands in the proxmox-shell and post the results:

Code:
ip a
ip route
ethtool enp1s0f0
ping 192.168.9.250 -c 4
ping 93.209.140.245 -c 4
ping 1.1.1.1 -c 4
Also, while downloading, does it show any (large) increase in CPU or memory-usage in the dashboard-tab of proxmox?
 
Hey!
The peformance ist good.
I tested it with a few Servers, Ubuntu is one of the fastest server i know.
But, i thought i know what the problem ist: The R8169 Chipset from Realtek
I found a few Threads but not a solution for the lastest Proxmox Server/Kernel.
root@proxmox:~# ip a
1: lo: <LOOPBACK,UP,LOWER_UP> mtu 65536 qdisc noqueue state UNKNOWN group default qlen 1000
link/loopback 00:00:00:00:00:00 brd 00:00:00:00:00:00
inet 127.0.0.1/8 scope host lo
valid_lft forever preferred_lft forever
inet6 ::1/128 scope host noprefixroute
valid_lft forever preferred_lft forever
2: enp1s0f0: <BROADCAST,MULTICAST,UP,LOWER_UP> mtu 1500 qdisc pfifo_fast master vmbr0 state UP group default qlen 1000
link/ether 6c:4b:90:9c:fb:99 brd ff:ff:ff:ff:ff:ff
3: vmbr0: <BROADCAST,MULTICAST,UP,LOWER_UP> mtu 1500 qdisc noqueue state UP group default qlen 1000
link/ether 6c:4b:90:9c:fb:99 brd ff:ff:ff:ff:ff:ff
inet 192.168.9.36/24 scope global vmbr0
valid_lft forever preferred_lft forever
inet6 fe80::6e4b:90ff:fe9c:fb99/64 scope link
valid_lft forever preferred_lft forever
root@proxmox:~# ip route
default via 192.168.9.1 dev vmbr0 proto kernel onlink
192.168.9.0/24 dev vmbr0 proto kernel scope link src 192.168.9.36
root@proxmox:~# ethtool enp1s0f0
Settings for enp1s0f0:
Supported ports: [ TP MII ]
Supported link modes: 10baseT/Half 10baseT/Full
100baseT/Half 100baseT/Full
1000baseT/Full
Supported pause frame use: Symmetric Receive-only
Supports auto-negotiation: Yes
Supported FEC modes: Not reported
Advertised link modes: 10baseT/Half 10baseT/Full
100baseT/Half 100baseT/Full
1000baseT/Full
Advertised pause frame use: Symmetric Receive-only
Advertised auto-negotiation: Yes
Advertised FEC modes: Not reported
Link partner advertised link modes: 10baseT/Half 10baseT/Full
100baseT/Half 100baseT/Full
1000baseT/Half 1000baseT/Full
Link partner advertised pause frame use: Symmetric Receive-only
Link partner advertised auto-negotiation: Yes
Link partner advertised FEC modes: Not reported
Speed: 1000Mb/s
Duplex: Full
Auto-negotiation: on
master-slave cfg: preferred slave
master-slave status: slave
Port: Twisted Pair
PHYAD: 0
Transceiver: external
MDI-X: Unknown
Supports Wake-on: pumbg
Wake-on: d
Link detected: yes
root@proxmox:~# ping 192..168.9.250
ping: 192..168.9.250: Name or service not known
root@proxmox:~# ping 192.168.9.250
PING 192.168.9.250 (192.168.9.250) 56(84) bytes of data.
64 bytes from 192.168.9.250: icmp_seq=1 ttl=64 time=434 ms
64 bytes from 192.168.9.250: icmp_seq=2 ttl=64 time=205 ms
64 bytes from 192.168.9.250: icmp_seq=3 ttl=64 time=211 ms
root@proxmox:~# ping 1.1.1.1 -c 4
PING 1.1.1.1 (1.1.1.1) 56(84) bytes of data.
64 bytes from 1.1.1.1: icmp_seq=1 ttl=59 time=28.7 ms
64 bytes from 1.1.1.1: icmp_seq=2 ttl=59 time=14.5 ms
64 bytes from 1.1.1.1: icmp_seq=3 ttl=59 time=17.1 ms

ping to 93.209.140.24 not working.
 

Attachments

  • 1722881571979.png
    1722881571979.png
    23.7 KB · Views: 3
  • 1722881681345.png
    1722881681345.png
    11.1 KB · Views: 3
For the last you made a typo, I said 245, or the host you're trying to get the data from.
Very strange that you have such a high time to your (local) router, and much lower to 1.1.1.1
As for the screenshots, I meant it more from the node, as there you can see to previous points in time, instead of just "now"

And yeah, it could be a kernel-issue, so you could try rolling back to an older version (or installing an older proxmox-iso 8.1 [1] and not upgrading yet)
[1] https://enterprise.proxmox.com/iso/
 

About

The Proxmox community has been around for many years and offers help and support for Proxmox VE, Proxmox Backup Server, and Proxmox Mail Gateway.
We think our community is one of the best thanks to people like you!

Get your subscription!

The Proxmox team works very hard to make sure you are running the best software and getting stable updates and security enhancements, as well as quick enterprise support. Tens of thousands of happy customers have a Proxmox subscription. Get yours easily in our online shop.

Buy now!