root@DISKTEST:~#
root@DISKTEST:~#
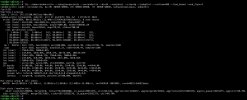
root@DISKTEST:~# fio --name=random-write --ioengine=posixaio --rw=randwrite --bs=4k --numjobs=1 --size=4g --iodepth=1 --runtime=60 --time_based --end_fsync=1
random-write: (g=0): rw=randwrite, bs=(R) 4096B-4096B, (W) 4096B-4096B, (T) 4096B-4096B, ioengine=posixaio, iodepth=1
fio-3.28
Starting 1 process
random-write: Laying out IO file (1 file / 4096MiB)
Jobs: 1 (f=1): [F(1)][100.0%][eta 00m:00s]
random-write: (groupid=0, jobs=1): err= 0: pid=792: Tue Jul 9 13:25:03 2024
write: IOPS=3772, BW=14.7MiB/s (15.5MB/s)(1184MiB/80360msec); 0 zone resets
slat (nsec): min=854, max=265835, avg=4021.27, stdev=4242.24
clat (nsec): min=313, max=282106k, avg=192360.71, stdev=1540685.34
lat (usec): min=12, max=282112, avg=196.38, stdev=1540.73
clat percentiles (nsec):
| 1.00th=[ 724], 5.00th=[ 13376], 10.00th=[ 14016],
| 20.00th=[ 14656], 30.00th=[ 15296], 40.00th=[ 15808],
| 50.00th=[ 16320], 60.00th=[ 17536], 70.00th=[ 20352],
| 80.00th=[ 24960], 90.00th=[ 30080], 95.00th=[ 37632],
| 99.00th=[ 9109504], 99.50th=[10682368], 99.90th=[16449536],
| 99.95th=[19529728], 99.99th=[34865152]
bw ( KiB/s): min=11200, max=184824, per=100.00%, avg=20258.29, stdev=27919.67, samples=119
iops : min= 2800, max=46206, avg=5064.59, stdev=6979.91, samples=119
lat (nsec) : 500=0.60%, 750=0.43%, 1000=0.27%
lat (usec) : 2=0.12%, 4=0.01%, 10=0.01%, 20=67.15%, 50=29.03%
lat (usec) : 100=0.73%, 250=0.06%, 500=0.01%, 750=0.01%, 1000=0.01%
lat (msec) : 2=0.01%, 4=0.01%, 10=0.85%, 20=0.70%, 50=0.04%
lat (msec) : 100=0.01%, 500=0.01%
cpu : usr=1.62%, sys=2.05%, ctx=366907, majf=0, minf=216
IO depths : 1=100.0%, 2=0.0%, 4=0.0%, 8=0.0%, 16=0.0%, 32=0.0%, >=64=0.0%
submit : 0=0.0%, 4=100.0%, 8=0.0%, 16=0.0%, 32=0.0%, 64=0.0%, >=64=0.0%
complete : 0=0.0%, 4=100.0%, 8=0.0%, 16=0.0%, 32=0.0%, 64=0.0%, >=64=0.0%
issued rwts: total=0,303144,0,0 short=0,0,0,0 dropped=0,0,0,0
latency : target=0, window=0, percentile=100.00%, depth=1
Run status group 0 (all jobs):
WRITE: bw=14.7MiB/s (15.5MB/s), 14.7MiB/s-14.7MiB/s (15.5MB/s-15.5MB/s), io=1184MiB (1242MB), run=80360-80360msec
Disk stats (read/write):
rbd0: ios=0/243508, merge=0/10298, ticks=0/4813583, in_queue=4813584, util=97.89%
root@DISKTEST:~#
root@DISKTEST:~#