Version information:
6.17.4-2-pve #1 SMP PREEMPT_DYNAMIC PMX 6.17.4-2 (2025-12-19T07:49Z) x86_64
PVE 9.1.4
Hi,
Recently, I've noticed that I have high IO delay. My current drive is a
The host is currently on an LVM-Thin install.
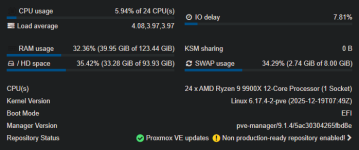
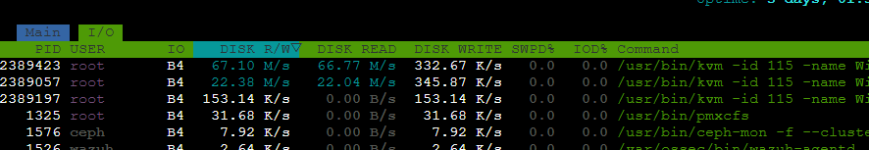
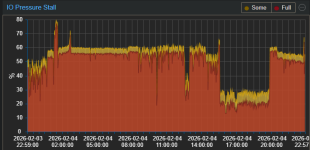
I've attached screenshots of various graphs, and they seem to be inconsistent in measurements. The update graph is almost always around 5-10%, while at the same time, htop can jump around 35-60% for live readings.
I was wondering if there's a way to see what could be causing the IO delay specifically. My most IO hungry VM is my Windows VM, which is my NVR, but when I shut it down, my IO stall never went down at all.
The only thing that solved the issue temporarily is shutting down the host and starting it back up. That will keep the stall near 0% with all VMs running as normal.
I've also provided the smart log in case anything could be useful.
6.17.4-2-pve #1 SMP PREEMPT_DYNAMIC PMX 6.17.4-2 (2025-12-19T07:49Z) x86_64
PVE 9.1.4
Hi,
Recently, I've noticed that I have high IO delay. My current drive is a
2TB Samsung 9100 PRO 2TB. I'm not noticing any performance issues, but I'm worried that something running could be eating the life out of my NVMe drive.The host is currently on an LVM-Thin install.
I've attached screenshots of various graphs, and they seem to be inconsistent in measurements. The update graph is almost always around 5-10%, while at the same time, htop can jump around 35-60% for live readings.
I was wondering if there's a way to see what could be causing the IO delay specifically. My most IO hungry VM is my Windows VM, which is my NVR, but when I shut it down, my IO stall never went down at all.
The only thing that solved the issue temporarily is shutting down the host and starting it back up. That will keep the stall near 0% with all VMs running as normal.
I've also provided the smart log in case anything could be useful.
Code:
SMART/Health Information (NVMe Log 0x02)
Critical Warning:                   0x00
Temperature:                        64 Celsius
Available Spare:                    100%
Available Spare Threshold:          10%
Percentage Used:                    20%
Data Units Read:                    76,645,554 [39.2 TB]
Data Units Written:                 463,380,766 [237 TB]
Host Read Commands:                 611,444,158
Host Write Commands:                6,123,086,438
Controller Busy Time:               9,472
Power Cycles:                       90
Power On Hours:                     1,866
Unsafe Shutdowns:                   62
Media and Data Integrity Errors:    0
Error Information Log Entries:      0
Warning  Comp. Temperature Time:    0
Critical Comp. Temperature Time:    0
Temperature Sensor 1:               69 Celsius
Temperature Sensor 2:               64 Celsius