Unable to wipe disk on proxmox
- Thread starter devrimer
- Start date
-
- Tags
- wipe wipe disks
You are using an out of date browser. It may not display this or other websites correctly.
You should upgrade or use an alternative browser.
You should upgrade or use an alternative browser.
Hi,
sea1tb-1 is the name of the storage. Disks/partitions assigned to a storage are showing this usage in Usage column in Storage => Disk overview. But in your screenshot the usage column states no.
Do you have only the two rows shown in the first screenshot or are there more entries?
For the second screenshot: it is an LVM. Click on your node and then in Disks => LVM you will see the disks/partitions it resides in. What is listed there?
Last edited:
Hi
I wanted to show you that sea1tb-1 looks full in the picture.
yes I have all of my disks. I just shared problematic one.
Here is the list of Disks => LVM
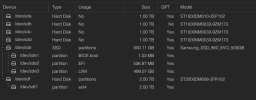
Thank you for your support.
Hi,Hi,
sea1tb-1 is the name of the storage. Disks/partitions assigned to a storage are showing this usage in Usage column in Storage => Disk overview. But in your screenshot the usage column states no.
Do you have only the two rows shown in the first screenshot or are there more entries?
For the second screenshot: it is an LVM. Click on your node and then in Disks => LVM you will see the disks/partitions it resides in. What is listed there?
I wanted to show you that sea1tb-1 looks full in the picture.
yes I have all of my disks. I just shared problematic one.
Here is the list of Disks => LVM

Thank you for your support.
You need to make sure that PVE is not using the disk for Storage (remove it in the GUI)
Then, you have a couple of options:
' wipefs -a /dev/sdb '
' dd if=/dev/zero of=/dev/sdb bs=1M count=100 status=progress '
MAKE SURE you put the right disk device in. I am NOT RESPONSIBLE for data loss!
If neither of these work, disk might be going bad
If it succeeds, then you can put a new GPT label on the disk with e.g. gdisk or parted
Thanks for the info,
I run those commands but it did not solved.
I believe this disk not in good condition.
how can I check this disk health status ?
and as you can see when I try to add disk I can see that sea1tb-1 is capacity and avail section is corrupted.
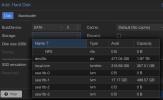
and can you explain what does this command makes exactly ?
' dd if=/dev/zero of=/dev/sdb bs=1M count=100 status=progress '
I do not know, that why I am asking.
Thanks for your support!
I run those commands but it did not solved.
I believe this disk not in good condition.
how can I check this disk health status ?
and as you can see when I try to add disk I can see that sea1tb-1 is capacity and avail section is corrupted.

and can you explain what does this command makes exactly ?
' dd if=/dev/zero of=/dev/sdb bs=1M count=100 status=progress '
I do not know, that why I am asking.
Thanks for your support!
Last edited:
The first 100MB of the disk are overwritten with zero's as there is the place where label, volume and filesystem informations reside on (first 2M but any further doesn't any hurt).
See disk health with "smartctl -x /dev/sdb".
See disk health with "smartctl -x /dev/sdb".
this is the output:
I do not understand so much. and what should I check in here?
many thanks!
dev@proxmachine:~# smartctl -x /dev/sdb
smartctl 7.3 2022-02-28 r5338 [x86_64-linux-6.8.12-5-pve] (local build)
Copyright (C) 2002-22, Bruce Allen, Christian Franke, www.smartmontools.org
=== START OF INFORMATION SECTION ===
Model Family: Seagate Constellation ES.3
Device Model: ST1000NM0033-9ZM173
Serial Number: Z1W21TRZ
LU WWN Device Id: 5 000c50 066eaff88
Firmware Version: SN06
User Capacity: 1,000,203,804,160 bytes [1.00 TB]
Sector Size: 512 bytes logical/physical
Rotation Rate: 7200 rpm
Form Factor: 3.5 inches
Device is: In smartctl database 7.3/5319
ATA Version is: ACS-2 (minor revision not indicated)
SATA Version is: SATA 3.0, 6.0 Gb/s (current: 3.0 Gb/s)
Local Time is: Thu Dec 19 00:23:32 2024 EET
SMART support is: Available - device has SMART capability.
SMART support is: Enabled
AAM feature is: Unavailable
APM feature is: Unavailable
Rd look-ahead is: Enabled
Write cache is: Enabled
DSN feature is: Unavailable
ATA Security is: Disabled, NOT FROZEN [SEC1]
Wt Cache Reorder: Unknown
=== START OF READ SMART DATA SECTION ===
SMART Status not supported: Incomplete response, ATA output registers missing
SMART overall-health self-assessment test result: PASSED
Warning: This result is based on an Attribute check.
See vendor-specific Attribute list for marginal Attributes.
General SMART Values:
Offline data collection status: (0x82) Offline data collection activity
was completed without error.
Auto Offline Data Collection: Enabled.
Self-test execution status: ( 0) The previous self-test routine completed
without error or no self-test has ever
been run.
Total time to complete Offline
data collection: ( 600) seconds.
Offline data collection
capabilities: (0x7b) SMART execute Offline immediate.
Auto Offline data collection on/off support.
Suspend Offline collection upon new
command.
Offline surface scan supported.
Self-test supported.
Conveyance Self-test supported.
Selective Self-test supported.
SMART capabilities: (0x0003) Saves SMART data before entering
power-saving mode.
Supports SMART auto save timer.
Error logging capability: (0x01) Error logging supported.
General Purpose Logging supported.
Short self-test routine
recommended polling time: ( 1) minutes.
Extended self-test routine
recommended polling time: ( 126) minutes.
Conveyance self-test routine
recommended polling time: ( 2) minutes.
SCT capabilities: (0x50bd) SCT Status supported.
SCT Error Recovery Control supported.
SCT Feature Control supported.
SCT Data Table supported.
SMART Attributes Data Structure revision number: 10
Vendor Specific SMART Attributes with Thresholds:
ID# ATTRIBUTE_NAME FLAGS VALUE WORST THRESH FAIL RAW_VALUE
1 Raw_Read_Error_Rate POSR-- 081 063 044 - 165082673
3 Spin_Up_Time PO---- 097 096 000 - 0
4 Start_Stop_Count -O--CK 076 076 020 - 24616
5 Reallocated_Sector_Ct PO--CK 100 100 010 - 7
7 Seek_Error_Rate POSR-- 090 060 030 - 1067796814
9 Power_On_Hours -O--CK 024 024 000 - 66744
10 Spin_Retry_Count PO--C- 100 100 097 - 0
12 Power_Cycle_Count -O--CK 100 100 020 - 539
184 End-to-End_Error -O--CK 100 100 099 - 0
187 Reported_Uncorrect -O--CK 100 100 000 - 0
188 Command_Timeout -O--CK 100 098 000 - 4295360518
189 High_Fly_Writes -O-RCK 100 100 000 - 0
190 Airflow_Temperature_Cel -O---K 049 039 045 Past 51 (213 130 52 41 0)
191 G-Sense_Error_Rate -O--CK 100 100 000 - 0
192 Power-Off_Retract_Count -O--CK 100 100 000 - 353
193 Load_Cycle_Count -O--CK 001 001 000 - 214622
194 Temperature_Celsius -O---K 051 061 000 - 51 (0 14 0 0 0)
195 Hardware_ECC_Recovered -O-RC- 021 008 000 - 165082673
197 Current_Pending_Sector -O--C- 100 100 000 - 0
198 Offline_Uncorrectable ----C- 100 100 000 - 0
199 UDMA_CRC_Error_Count -OSRCK 200 090 000 - 528126
||||||_ K auto-keep
|||||__ C event count
||||___ R error rate
|||____ S speed/performance
||_____ O updated online
|______ P prefailure warning
General Purpose Log Directory Version 1
SMART Log Directory Version 1 [multi-sector log support]
Address Access R/W Size Description
0x00 GPL,SL R/O 1 Log Directory
0x01 SL R/O 1 Summary SMART error log
0x02 SL R/O 5 Comprehensive SMART error log
0x03 GPL R/O 5 Ext. Comprehensive SMART error log
0x04 GPL,SL R/O 8 Device Statistics log
0x06 SL R/O 1 SMART self-test log
0x07 GPL R/O 1 Extended self-test log
0x08 GPL R/O 2 Power Conditions log
0x09 SL R/W 1 Selective self-test log
0x10 GPL R/O 1 NCQ Command Error log
0x11 GPL R/O 1 SATA Phy Event Counters log
0x21 GPL R/O 1 Write stream error log
0x22 GPL R/O 1 Read stream error log
0x24 GPL R/O 512 Current Device Internal Status Data log
0x30 GPL,SL R/O 9 IDENTIFY DEVICE data log
0x80-0x9f GPL,SL R/W 16 Host vendor specific log
0xa1 GPL,SL VS 20 Device vendor specific log
0xa2 GPL VS 4496 Device vendor specific log
0xa6 GPL VS 192 Device vendor specific log
0xa8 GPL,SL VS 129 Device vendor specific log
0xa9 GPL,SL VS 1 Device vendor specific log
0xad GPL VS 16 Device vendor specific log
0xb0 GPL VS 5176 Device vendor specific log
0xbd GPL VS 512 Device vendor specific log
0xbe-0xbf GPL VS 65535 Device vendor specific log
0xc1 GPL,SL VS 10 Device vendor specific log
0xc3 GPL,SL VS 8 Device vendor specific log
0xd1 GPL VS 39 Device vendor specific log
0xe0 GPL,SL R/W 1 SCT Command/Status
0xe1 GPL,SL R/W 1 SCT Data Transfer
SMART Extended Comprehensive Error Log Version: 1 (5 sectors)
No Errors Logged
SMART Extended Self-test Log Version: 1 (1 sectors)
Num Test_Description Status Remaining LifeTime(hours) LBA_of_first_error
# 1 Short offline Completed without error 00% 45684 -
# 2 Short offline Completed without error 00% 45012 -
# 3 Short offline Completed without error 00% 44268 -
# 4 Short offline Completed without error 00% 43524 -
# 5 Short offline Completed without error 00% 42809 -
# 6 Short offline Completed without error 00% 42083 -
# 7 Short offline Completed without error 00% 41717 -
# 8 Short offline Completed without error 00% 41239 -
# 9 Short offline Completed without error 00% 40743 -
#10 Short offline Completed without error 00% 40074 -
#11 Short offline Completed without error 00% 39330 -
#12 Short offline Completed without error 00% 38586 -
#13 Short offline Completed without error 00% 37866 -
#14 Short offline Completed without error 00% 37121 -
#15 Short offline Completed without error 00% 36401 -
#16 Short offline Completed without error 00% 35657 -
#17 Short offline Completed without error 00% 34913 -
#18 Short offline Completed without error 00% 34193 -
#19 Short offline Completed without error 00% 33449 -
SMART Selective self-test log data structure revision number 1
SPAN MIN_LBA MAX_LBA CURRENT_TEST_STATUS
1 0 0 Not_testing
2 0 0 Not_testing
3 0 0 Not_testing
4 0 0 Not_testing
5 0 0 Not_testing
Selective self-test flags (0x0):
After scanning selected spans, do NOT read-scan remainder of disk.
If Selective self-test is pending on power-up, resume after 0 minute delay.
SCT Status Version: 3
SCT Version (vendor specific): 522 (0x020a)
Device State: Active (0)
Current Temperature: 51 Celsius
Power Cycle Min/Max Temperature: 41/52 Celsius
Lifetime Min/Max Temperature: 14/61 Celsius
Under/Over Temperature Limit Count: 0/810
SCT Temperature History Version: 2
Temperature Sampling Period: 1 minute
Temperature Logging Interval: 10 minutes
Min/Max recommended Temperature: 0/ 0 Celsius
Min/Max Temperature Limit: 0/ 0 Celsius
Temperature History Size (Index): 128 (120)
Index Estimated Time Temperature Celsius
121 2024-12-18 03:10 50 *******************************
... ..( 15 skipped). .. *******************************
9 2024-12-18 05:50 50 *******************************
10 2024-12-18 06:00 ? -
11 2024-12-18 06:10 50 *******************************
... ..( 7 skipped). .. *******************************
19 2024-12-18 07:30 50 *******************************
20 2024-12-18 07:40 51 ********************************
... ..( 3 skipped). .. ********************************
24 2024-12-18 08:20 51 ********************************
25 2024-12-18 08:30 ? -
26 2024-12-18 08:40 51 ********************************
... ..( 14 skipped). .. ********************************
41 2024-12-18 11:10 51 ********************************
42 2024-12-18 11:20 ? -
43 2024-12-18 11:30 51 ********************************
... ..( 4 skipped). .. ********************************
48 2024-12-18 12:20 51 ********************************
49 2024-12-18 12:30 50 *******************************
50 2024-12-18 12:40 50 *******************************
51 2024-12-18 12:50 50 *******************************
52 2024-12-18 13:00 ? -
53 2024-12-18 13:10 50 *******************************
54 2024-12-18 13:20 50 *******************************
55 2024-12-18 13:30 51 ********************************
... ..( 11 skipped). .. ********************************
67 2024-12-18 15:30 51 ********************************
68 2024-12-18 15:40 ? -
69 2024-12-18 15:50 51 ********************************
... ..( 8 skipped). .. ********************************
78 2024-12-18 17:20 51 ********************************
79 2024-12-18 17:30 ? -
80 2024-12-18 17:40 51 ********************************
81 2024-12-18 17:50 51 ********************************
82 2024-12-18 18:00 51 ********************************
83 2024-12-18 18:10 ? -
84 2024-12-18 18:20 51 ********************************
... ..( 5 skipped). .. ********************************
90 2024-12-18 19:20 51 ********************************
91 2024-12-18 19:30 ? -
92 2024-12-18 19:40 51 ********************************
... ..( 6 skipped). .. ********************************
99 2024-12-18 20:50 51 ********************************
100 2024-12-18 21:00 ? -
101 2024-12-18 21:10 51 ********************************
102 2024-12-18 21:20 50 *******************************
103 2024-12-18 21:30 ? -
104 2024-12-18 21:40 50 *******************************
... ..( 14 skipped). .. *******************************
119 2024-12-19 00:10 50 *******************************
120 2024-12-19 00:20 51 ********************************
SMART WRITE LOG does not return COUNT and LBA_LOW register
SCT (Get) Error Recovery Control command failed
Device Statistics (GP Log 0x04)
Page Offset Size Value Flags Description
0x01 ===== = = === == General Statistics (rev 1) ==
0x01 0x008 4 539 --- Lifetime Power-On Resets
0x01 0x010 4 66744 --- Power-on Hours
0x01 0x018 6 26600684707 --- Logical Sectors Written
0x01 0x020 6 174132250 --- Number of Write Commands
0x01 0x028 6 27818486291 --- Logical Sectors Read
0x01 0x030 6 81556202 --- Number of Read Commands
0x01 0x038 6 - --- Date and Time TimeStamp
0x03 ===== = = === == Rotating Media Statistics (rev 1) ==
0x03 0x008 4 63897 --- Spindle Motor Power-on Hours
0x03 0x010 4 10253 --- Head Flying Hours
0x03 0x018 4 214622 --- Head Load Events
0x03 0x020 4 7 --- Number of Reallocated Logical Sectors
0x03 0x028 4 0 --- Read Recovery Attempts
0x03 0x030 4 0 --- Number of Mechanical Start Failures
0x03 0x038 4 0 --- Number of Realloc. Candidate Logical Sectors
0x03 0x040 4 354 --- Number of High Priority Unload Events
0x04 ===== = = === == General Errors Statistics (rev 1) ==
0x04 0x008 4 0 --- Number of Reported Uncorrectable Errors
0x04 0x010 4 6 --- Resets Between Cmd Acceptance and Completion
0x05 ===== = = === == Temperature Statistics (rev 1) ==
0x05 0x008 1 51 --- Current Temperature
0x05 0x020 1 61 --- Highest Temperature
0x05 0x028 1 18 --- Lowest Temperature
0x05 0x030 1 - --- Highest Average Short Term Temperature
0x05 0x038 1 - --- Lowest Average Short Term Temperature
0x05 0x040 1 - --- Highest Average Long Term Temperature
0x05 0x048 1 - --- Lowest Average Long Term Temperature
0x05 0x050 4 82141 --- Time in Over-Temperature
0x05 0x058 1 55 --- Specified Maximum Operating Temperature
0x05 0x060 4 0 --- Time in Under-Temperature
0x05 0x068 1 13 --- Specified Minimum Operating Temperature
|||_ C monitored condition met
||__ D supports DSN
|___ N normalized value
Pending Defects log (GP Log 0x0c) not supported
SATA Phy Event Counters (GP Log 0x11)
ID Size Value Description
0x000a 2 11 Device-to-host register FISes sent due to a COMRESET
0x0001 2 0 Command failed due to ICRC error
0x0003 2 0 R_ERR response for device-to-host data FIS
0x0004 2 0 R_ERR response for host-to-device data FIS
0x0006 2 0 R_ERR response for device-to-host non-data FIS
0x0007 2 0 R_ERR response for host-to-device non-data FIS
To smartctl output - for hdd's these 3 lines are the most important to health status :
5 Reallocated_Sector_Ct PO--CK 100 100 010 - 7 # 7 sectors were bad in the past and were replaced by reserve ones
197 Current_Pending_Sector -O--C- 100 100 000 - 0 # Actual no tries of repair of unread(/write/)able sectors from firmware
198 Offline_Uncorrectable ----C- 100 100 000 - 0 # When >0 buy new disk and change it, so this disk looks good.
There could be lot of other cmd timeout and errors reported but not the case here now but if ... think for new disk again.
It depends what you mean !and how can I add those disks to my vm ?
You could passthrough the physical disk to a vm.
You could make a lvm or zfs zvol or even filesystem onto and create an additional virtual disk for your vm layed down in that.
Maybe you should read a little bit more about storage usage in the pve documentation as this never is a bad idea.
those disk were using on my vm;
sea1tb-0, sea1tb-1, sea1tb-2, sea1tb-3
and I removed them from vm via web gui.
and I wipe them in node section disk area.
now I want to add those disks to my same vm.
how can I do that?
those are the disks that I want to add to my vm:
sea1tb-0, sea1tb-2, sea1tb-3
because sea1tb-1 is not working anymore.
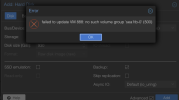
I tired in my vm hardware section. but I am getting this error: failed to update VM 104: no such volume group 'sea1tb-0' (500)
Last edited:
You hadn't added physical disks to the vm but logical ones (LVMs) which resides on the physical disks. LVM is a structure for organizing the data stored on physical disks. sea1tb-0, sea1tb-1, sea1tb-2, sea1tb-3 were most likely all names of LVM you had before. If you wipe a disk, the LVM is gone of course. And what's gone can't be assigned.
waltar already mentioned the options you have, so what is it, what you want to do? Pass-through the physical disks? There is a wiki entry for that: https://pve.proxmox.com/wiki/Passthrough_Physical_Disk_to_Virtual_Machine_(VM)
Other wise just follow waltar's advice and recreate whatever structure you need on the disks with gui and then add them to your vm.


