Hello All,
90% of the time when I go to the track and want to get a quick look at how many messages came in, in some cases from a certain sender ( to insure a new rule allowed mail to flow properly) I get a time out, here is 1 example:
command '/usr/bin/pmg-log-tracker -v -l 2000 -s 1627352460 -e 1627358400 -n -g -f anything@something.com' failed: got timeout (500)
Sometimes I do also search for both the sender and recipient, but still getting timeouts.
I use the default settings which look to search in the past 24 hours roughly.
For reference maybe 10-15K messages come in during the day.
System is Virtual running under vmware, 1 processor 4GB.
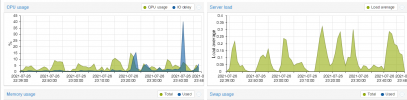
Processor looks good (photo attached)
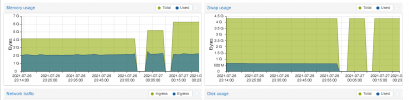
I did see memory reaching around 80%, so I bumped it up to 6GB.
You can see in the 2nd image, each bum in memory still peaked to the same point (4-5-6GB).
Is what I'm having an issue with more about memory or cpu, or maybe something else?
I do look at the box during the day with TOP runs fine, nothing peaking too high, memory looking ok, disk ok.
FYI another test, I do a fresh reboot, within 1 minute of the reboot, you can see all system resources are looking great, run the same search in tracking center times out.
Any suggestions or ideas appreciated!
Thanks!
90% of the time when I go to the track and want to get a quick look at how many messages came in, in some cases from a certain sender ( to insure a new rule allowed mail to flow properly) I get a time out, here is 1 example:
command '/usr/bin/pmg-log-tracker -v -l 2000 -s 1627352460 -e 1627358400 -n -g -f anything@something.com' failed: got timeout (500)
Sometimes I do also search for both the sender and recipient, but still getting timeouts.
I use the default settings which look to search in the past 24 hours roughly.
For reference maybe 10-15K messages come in during the day.
System is Virtual running under vmware, 1 processor 4GB.
Processor looks good (photo attached)
I did see memory reaching around 80%, so I bumped it up to 6GB.
You can see in the 2nd image, each bum in memory still peaked to the same point (4-5-6GB).
Is what I'm having an issue with more about memory or cpu, or maybe something else?
I do look at the box during the day with TOP runs fine, nothing peaking too high, memory looking ok, disk ok.
FYI another test, I do a fresh reboot, within 1 minute of the reboot, you can see all system resources are looking great, run the same search in tracking center times out.
Any suggestions or ideas appreciated!
Thanks!