Hi, I'm not a developer, but I'll try to answer.
At least two things can be parts of the explanation.
1) The way Linux uses memory.
If it has free RAM, it uses it

. For cache and buffers. To quickly access the same data if needed.
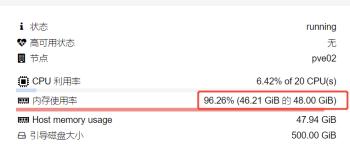
In your example: used 14 + buff/cache 31 = 45 which is approximately 46 shown in the PVE GUI.
E.g. for one of my machines at the moment:
The PVE GUI is showing: "Memory usage 38.07% (779.59 MiB of 2.00 GiB)"
And inside the VM:
Bash:
$ free -h
               total        used        free      shared  buff/cache   available
Mem:           1.9Gi       443Mi       1.1Gi       1.6Mi       546Mi       1.5Gi
Now I'll empty the pagecache, dentries, and inodes:
Bash:
# echo 3 > /proc/sys/vm/drop_caches
[1228771.039453] bash (174831): drop_caches: 3
# free -h
               total        used        free      shared  buff/cache   available
Mem:           1.9Gi       331Mi       1.6Gi       1.6Mi        54Mi       1.6Gi
Now the PVE GUI is showing: "Memory usage 19.59% (401.26 MiB of 2.00 GiB)"
It's in PVE 8.4.14.
2) In PVE 9 there is additional possible reason:
https://pve.proxmox.com/wiki/Upgrade_from_8_to_9#VM_Memory_Consumption_Shown_is_Higher


