Over the last 2 days, specifically around 8:30 EST Jan 13 until 9 AM EST Jan 14, my home network had been slow. Most devices were having some issues connecting locally and to the internet - TV, phones etc. Netflix, Youtube apps on TV were buffering, Instagram and other apps were slow to load etc. This issue occurred on devices that were connected over wireless and wired. Strangely, my PC that is connected to same switch as my MBP was unable to load most web pages while the MBP had no issues. Proxmox login page timed out several times, grafana instance running on lxc container was slow to load, SSH to lxc containers and proxmox server was taking much longer than usual. At first I thought the router is having issues but when things weren't working locally either I started to look at Proxmox server. I checked some logs but weren't really sure if and where I would find any evidence or hint of what might have been going wrong. On the morning on Jan 14, around 9 AM I rebooted the modem and things started working again right away.
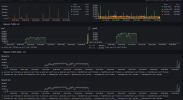
Now, I am lost as to why my home router having issues would cause my local home web apps to not work, or why SSH would take forever to connect. Luckily, I had grafana instance connected to proxmox and saw these high network utilization graphs. The timing of the unusually high traffic matches when I first started noticing the slowness (8:30 PM Jan 13 until modem was rebooted on Jan 14 at 9 AM).

All LXC containers show around 30 MB/s traffic IN but barely any traffic OUT.

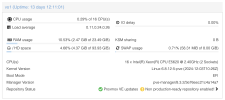
Here's a screenshot of total resources on this physical Dell server running proxmox.

The only thing I did after installing Proxmox was start 4 debian lxc containers from the default templates and then ran a script to disable subscription notice on login, disable enterprise repos and enable no-subscription repos about 10 days ago.
Now, I am lost as to why my home router having issues would cause my local home web apps to not work, or why SSH would take forever to connect. Luckily, I had grafana instance connected to proxmox and saw these high network utilization graphs. The timing of the unusually high traffic matches when I first started noticing the slowness (8:30 PM Jan 13 until modem was rebooted on Jan 14 at 9 AM).

All LXC containers show around 30 MB/s traffic IN but barely any traffic OUT.

Here's a screenshot of total resources on this physical Dell server running proxmox.

The only thing I did after installing Proxmox was start 4 debian lxc containers from the default templates and then ran a script to disable subscription notice on login, disable enterprise repos and enable no-subscription repos about 10 days ago.
Last edited:

