Replication Jobs failing with timeout now and then

maxim.webster

Active Member
Nov 12, 2024
295
141
43
Germany
So,

I do run a 3-Cluster in my homelab, using ZFS replikation for HA. Node names are bert, ernie and grobi.

Everything is running fine most of the time, but now and then for a period of 15-30min all replikation jobs fail like this.

Replication job '104-0' with target 'bert' and schedule '0/15' failed!

Last successful sync: 2026-10-11 01:45:01
Next sync try: ERROR
Failure count: 1

Error:
command 'zfs snapshot local-zfs/subvol-104-disk-0@__replicate_104-0_1791676801__' failed: got timeout
There is - at the same time a „spike“ in CPU usage (up to 8-9%) but aside from that nothing unusual.

How can i identify the real cause?
 
I’d like to check for any storage-related delays or errors. Could you please share the output of the following commands?

Code:
zpool status -v
zpool events -v
 
On bert (target):

zpool status -v
pool: local-zfs
state: ONLINE
scan: scrub repaired 0B in 02:50:54 with 0 errors on Sun Oct 11 03:14:56 2026
config:

NAME STATE READ WRITE CKSUM
local-zfs ONLINE 0 0 0
mirror-0 ONLINE 0 0 0
ata-WDC_WD40EFZX-68AWUN0_WD-WX62D62E45YJ ONLINE 0 0 0
ata-WDC_WD40EFZX-68AWUN0_WD-WX62D62LXNKX ONLINE 0 0 0

errors: No known data errors

zpool events -v shows basically the same event every 4 minutes, but does not go far enough to the past. Can I limit the output to a certain period in time?

zpool events -v | head -n 30
TIME CLASS
Oct 11 2026 13:25:03.679682485 sysevent.fs.zfs.history_event
version = 0x0
class = "sysevent.fs.zfs.history_event"
pool = "local-zfs"
pool_guid = 0x57ae29347af09840
pool_state = 0x0
pool_context = 0x0
history_hostname = "bert"
history_dsname = "local-zfs/vm-100-disk-0@__replicate_100-0_1791717600__"
history_internal_str = " "
history_internal_name = "snapshot"
history_dsid = 0xf203
history_txg = 0xd33884
history_time = 0x6acb720f
time = 0x6acb720f 0x288321b5
eid = 0x7c448
 
Thank you for sharing the output. The commands I suggested earlier were useful for checking the overall health of the ZFS pool. However, to investigate a temporary delay during a specific period, we also need to examine the system journal.

Could you please share the system journal from around the time of the failure on the source node of the failed replication job?

For example:

Code:
journalctl --since "2026-10-11 01:30:00" --until "2026-10-11 02:30:00" --no-pager

Please adjust the timestamps to match the actual time of the failure.
 
I am having trouble to identify the source node, as they all use the same e-mail-sender adress and the E-Mail content does only name the target.

I do know however, that the volume reported is associated to a CT, which currently is on node „ernie“. The mail was sent at 03:45, so but Journal shows nothing but the actual error.

Oct 11 03:45:17 ernie Keepalived_vrrp[2285]: (VI_1) WARNING - equal priority advert received from remote host with our IP address.
Oct 11 03:45:17 ernie pvescheduler[3203084]: 104-0: got unexpected replication job error - command 'zfs snapshot local-zfs/subvol-104-disk-0@__replicate_104-0_1791683102__' failed: got timeout
Oct 11 03:45:17 ernie perl[3203084]: skipping disabled matcher 'default-matcher-smtp'
Oct 11 03:45:17 ernie perl[3203084]: skipping disabled matcher 'default-matcher'
Oct 11 03:45:17 ernie perl[3203084]: could not render value null with renderer Timestamp
Oct 11 03:45:18 ernie Keepalived_vrrp[2285]: (VI_1) WARNING - equal priority advert received from remote host with our IP address.
Oct 11 03:45:18 ernie perl[3203084]: notified via target `mail-to-hostmaster`
Oct 11 03:45:19 ernie Keepalived_vrrp[2285]: (VI_1) WARNING - equal priority advert received from remote host with our IP address.
 
It looks like the ZFS snapshot command timed out on ernie.

Could you check whether I/O delay increased around that time, or whether any I/O-intensive tasks, such as a ZFS scrub or backup, were running?

Since I cannot check the system’s state at the time of the failure, I searched for similar forum posts. However, the root cause does not appear to have been identified there either. I hope this helps:

 
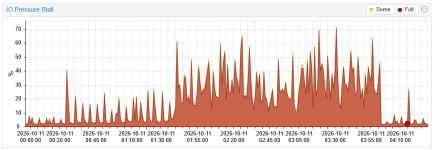
Could you check whether I/O delay increased around that time, or whether any I/O-intensive tasks, such as a ZFS scrub or backup, were running?

IO Stall definitely increased, but I don't know the reason. It's definitely not related to backups, I have a backup at 03:00, but that ended at 03:01.

1791746053738.png