PVE got a few errors and then hang after a few hours

Singman

Active Member
Sep 13, 2019
27
1
43
57
Hi,

I'm trying to find why one of my PVE host is crashing randomly.
My configuration is a cluster of 3x nodes + Ceph

dmesg part 1 :
Code:
Feb 18 10:57:48 pve12 ceph-osd[1136]: 2025-02-18T10:57:48.853+0100 7a167f8006c0 -1 osd.2 1118 get_health_metrics reporting 256 slow ops, oldest is osd_op(client.364115.0:109>
Feb 18 10:57:48 pve12 systemd[1]: /lib/systemd/system/ceph-volume@.service:8: Unit uses KillMode=none. This is unsafe, as it disables systemd's process lifecycle management >
Feb 18 10:57:48 pve12 systemd[1]: Mounting mnt-pve-CephFS.mount - /mnt/pve/CephFS...
Feb 18 10:57:48 pve12 kernel: libceph: mon1 (1)192.168.1.15:6789 session established
Feb 18 10:57:48 pve12 mount[388122]: mount error: no mds (Metadata Server) is up. The cluster might be laggy, or you may not be authorized
Feb 18 10:57:48 pve12 kernel: libceph: client394795 fsid dd2f620b-222c-4f2b-af63-77c37ca60b85
Feb 18 10:57:48 pve12 kernel: ceph: No mds server is up or the cluster is laggy
Feb 18 10:57:48 pve12 systemd[1]: mnt-pve-CephFS.mount: Mount process exited, code=exited, status=32/n/a
Feb 18 10:57:48 pve12 systemd[1]: mnt-pve-CephFS.mount: Failed with result 'exit-code'.
Feb 18 10:57:48 pve12 systemd[1]: Failed to mount mnt-pve-CephFS.mount - /mnt/pve/CephFS.
Feb 18 10:57:48 pve12 pvestatd[1102]: mount error: Job failed. See "journalctl -xe" for details.
Feb 18 10:57:49 pve12 ceph-osd[1136]: 2025-02-18T10:57:49.806+0100 7a167f8006c0 -1 osd.2 1118 get_health_metrics reporting 256 slow ops, oldest is osd_op(client.364115.0:109>
Feb 18 10:57:50 pve12 ceph-osd[1136]: 2025-02-18T10:57:50.849+0100 7a167f8006c0 -1 osd.2 1118 get_health_metrics reporting 256 slow ops, oldest is osd_op(client.364115.0:109>
Feb 18 10:57:51 pve12 ceph-osd[1136]: 2025-02-18T10:57:51.829+0100 7a167f8006c0 -1 osd.2 1118 get_health_metrics reporting 256 slow ops, oldest is osd_op(client.364115.0:109>
Feb 18 10:57:52 pve12 ceph-osd[1136]: 2025-02-18T10:57:52.879+0100 7a167f8006c0 -1 osd.2 1118 get_health_metrics reporting 256 slow ops, oldest is osd_op(client.364115.0:109>
Feb 18 10:57:53 pve12 ceph-osd[1136]: 2025-02-18T10:57:53.898+0100 7a167f8006c0 -1 osd.2 1118 get_health_metrics reporting 256 slow ops, oldest is osd_op(client.364115.0:109>
Feb 18 10:57:54 pve12 ceph-osd[1136]: 2025-02-18T10:57:54.856+0100 7a167f8006c0 -1 osd.2 1118 get_health_metrics reporting 256 slow ops, oldest is osd_op(client.364115.0:109>
Feb 18 10:57:55 pve12 kernel: INFO: task kmmpd-rbd0:2016 blocked for more than 122 seconds.
Feb 18 10:57:55 pve12 kernel:       Tainted: P           O       6.8.12-8-pve #1
Feb 18 10:57:55 pve12 kernel: "echo 0 > /proc/sys/kernel/hung_task_timeout_secs" disables this message.
Feb 18 10:57:55 pve12 kernel: task:kmmpd-rbd0      state:D stack:0     pid:2016  tgid:2016  ppid:2      flags:0x00004000
Feb 18 10:57:55 pve12 kernel: Call Trace:
Feb 18 10:57:55 pve12 kernel:  <TASK>
Feb 18 10:57:55 pve12 kernel:  __schedule+0x42b/0x1500
Feb 18 10:57:55 pve12 kernel:  schedule+0x33/0x110
Feb 18 10:57:55 pve12 kernel:  io_schedule+0x46/0x80
Feb 18 10:57:55 pve12 kernel:  bit_wait_io+0x11/0x90
Feb 18 10:57:55 pve12 kernel:  __wait_on_bit+0x4a/0x120
Feb 18 10:57:55 pve12 kernel:  ? __pfx_bit_wait_io+0x10/0x10
Feb 18 10:57:55 pve12 kernel:  out_of_line_wait_on_bit+0x8c/0xb0
Feb 18 10:57:55 pve12 kernel:  ? __pfx_wake_bit_function+0x10/0x10
Feb 18 10:57:55 pve12 kernel:  __wait_on_buffer+0x30/0x50
Feb 18 10:57:55 pve12 kernel:  write_mmp_block_thawed+0xfa/0x120
Feb 18 10:57:55 pve12 kernel:  write_mmp_block+0x46/0xd0
Feb 18 10:57:55 pve12 kernel:  kmmpd+0x1ab/0x430
Feb 18 10:57:55 pve12 kernel:  ? __pfx_kmmpd+0x10/0x10
Feb 18 10:57:55 pve12 kernel:  kthread+0xef/0x120
Feb 18 10:57:55 pve12 kernel:  ? __pfx_kthread+0x10/0x10
Feb 18 10:57:55 pve12 kernel:  ret_from_fork+0x44/0x70
Feb 18 10:57:55 pve12 kernel:  ? __pfx_kthread+0x10/0x10
Feb 18 10:57:55 pve12 kernel:  ret_from_fork_asm+0x1b/0x30
Feb 18 10:57:55 pve12 kernel:  </TASK>

Then many many lines with
Code:
Feb 18 12:24:59 pve12 ceph-osd[1136]: 2025-02-18T12:24:59.529+0100 7a167f8006c0 -1 osd.2 1118 get_health_metrics reporting 256 slow ops, oldest is osd_op(client.364115.0:109>
Feb 18 12:25:00 pve12 ceph-osd[1136]: 2025-02-18T12:25:00.500+0100 7a167f8006c0 -1 osd.2 1118 get_health_metrics reporting 256 slow ops, oldest is osd_op(client.364115.0:109>
Feb 18 12:25:01 pve12 ceph-osd[1136]: 2025-02-18T12:25:01.477+0100 7a167f8006c0 -1 osd.2 1118 get_health_metrics reporting 256 slow ops, oldest is osd_op(client.364115.0:109>
Feb 18 12:25:02 pve12 ceph-osd[1136]: 2025-02-18T12:25:02.494+0100 7a167f8006c0 -1 osd.2 1118 get_health_metrics reporting 256 slow ops, oldest is osd_op(client.364115.0:109>
Feb 18 12:25:03 pve12 ceph-osd[1136]: 2025-02-18T12:25:03.519+0100 7a167f8006c0 -1 osd.2 1118 get_health_metrics reporting 256 slow ops, oldest is osd_op(client.364115.0:109>
Feb 18 12:25:04 pve12 ceph-osd[1136]: 2025-02-18T12:25:04.470+0100 7a167f8006c0 -1 osd.2 1118 get_health_metrics reporting 256 slow ops, oldest is osd_op(client.364115.0:109>
Feb 18 12:25:05 pve12 ceph-osd[1136]: 2025-02-18T12:25:05.436+0100 7a167f8006c0 -1 osd.2 1118 get_health_metrics reporting 256 slow ops, oldest is osd_op(client.364115.0:109>
Feb 18 12:25:06 pve12 ceph-osd[1136]: 2025-02-18T12:25:06.427+0100 7a167f8006c0 -1 osd.2 1118 get_health_metrics reporting 256 slow ops, oldest is osd_op(client.364115.0:10
And then the server hang...

Cepth configuration on this host (pve12) :
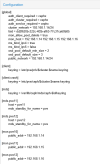
1739903212896.png
1739903247756.png
1739903259993.png

1739903286895.png
1739903301641.png
 
Hum, I don't understand why node pve12 is trying to mount a CephFS because I don't have one :
Code:
root@pve12:/# ceph fs ls
No filesystems enabled
 
Code:
[ 4455.646751] watchdog: BUG: soft lockup - CPU#0 stuck for 302s! [pvestatd:1087]
[ 4455.647541] Modules linked in: dummy ceph cfg80211 veth cmac nls_utf8 cifs cifs_arc4 nls_ucs2_utils rdma_cm iw_cm ib_cm ib_core cifs_md4 netfs rbd libceph ebtable_filter ebtables ip_set ip6table_raw iptable_raw ip6table_filter ip6_tables iptable_filter sctp ip6_udp_tunnel udp_tunnel nf_tables nvme_fabrics nvme_keyring bonding tls softdog sunrpc nfnetlink_log nfnetlink binfmt_misc xe drm_gpuvm drm_exec gpu_sched intel_rapl_msr intel_rapl_common drm_suballoc_helper drm_ttm_helper intel_uncore_frequency intel_uncore_frequency_common snd_hda_codec_hdmi x86_pkg_temp_thermal intel_powerclamp coretemp kvm_intel i915 kvm snd_sof_pci_intel_tgl snd_sof_intel_hda_common irqbypass crct10dif_pclmul soundwire_intel polyval_clmulni polyval_generic ghash_clmulni_intel snd_sof_intel_hda_mlink soundwire_cadence sha256_ssse3 sha1_ssse3 snd_sof_intel_hda drm_buddy aesni_intel snd_sof_pci ttm snd_sof_xtensa_dsp crypto_simd drm_display_helper cryptd snd_sof cec mei_pxp mei_hdcp snd_sof_utils snd_soc_hdac_hda snd_hda_ext_core
[ 4455.647610]  snd_soc_acpi_intel_match snd_soc_acpi soundwire_generic_allocation soundwire_bus snd_soc_core snd_compress ac97_bus snd_pcm_dmaengine rapl snd_hda_intel snd_intel_dspcfg snd_intel_sdw_acpi snd_hda_codec snd_hda_core snd_hwdep snd_pcm cmdlinepart snd_timer spi_nor snd intel_cstate pcspkr soundcore wmi_bmof mtd mei_me rc_core mei i2c_algo_bit intel_pmc_core intel_vsec pmt_telemetry pmt_class acpi_tad acpi_pad joydev input_leds mac_hid zfs(PO) spl(O) vhost_net vhost vhost_iotlb tap efi_pstore dmi_sysfs ip_tables x_tables autofs4 btrfs blake2b_generic xor raid6_pq hid_generic usbkbd usbhid hid dm_thin_pool dm_persistent_data dm_bio_prison dm_bufio libcrc32c xhci_pci nvme xhci_pci_renesas crc32_pclmul spi_intel_pci i2c_i801 nvme_core i2c_smbus spi_intel xhci_hcd igc ahci libahci nvme_auth video wmi
[ 4455.656025] CPU: 0 PID: 1087 Comm: pvestatd Tainted: P      D    O L     6.8.12-8-pve #1
[ 4455.656682] Hardware name: Default string Default string/Default string, BIOS HSX126LV10S001A 04/03/2024
[ 4455.657335] RIP: 0010:native_queued_spin_lock_slowpath+0x7f/0x2d0
[ 4455.657992] Code: 00 00 f0 0f ba 2b 08 0f 92 c2 8b 03 0f b6 d2 c1 e2 08 30 e4 09 d0 3d ff 00 00 00 77 5f 85 c0 74 10 0f b6 03 84 c0 74 09 f3 90 <0f> b6 03 84 c0 75 f7 b8 01 00 00 00 66 89 03 5b 41 5c 41 5d 41 5e
[ 4455.659294] RSP: 0018:ffffa84e06273b28 EFLAGS: 00000202
[ 4455.659945] RAX: 0000000000000001 RBX: fffff892c98fc568 RCX: 000fffffffe00000
[ 4455.660593] RDX: 0000000000000000 RSI: 0000000000000001 RDI: fffff892c98fc568
[ 4455.661257] RBP: ffffa84e06273b48 R08: 0000000000000000 R09: 0000000000000000
[ 4455.661909] R10: 0000000000000000 R11: 0000000000000000 R12: ffff9c158a013408
[ 4455.662551] R13: 00005942d0200000 R14: ffffa84e06273c58 R15: ffff9c16e3f15000
[ 4455.663200] FS:  0000000000000000(0000) GS:ffff9c1d0f800000(0000) knlGS:0000000000000000
[ 4455.663852] CS:  0010 DS: 0000 ES: 0000 CR0: 0000000080050033
[ 4455.664494] CR2: 00005942d0363b44 CR3: 00000002489a6000 CR4: 0000000000f50ef0
[ 4455.665147] PKRU: 55555554
[ 4455.665794] Call Trace:
[ 4455.666436]  <IRQ>
[ 4455.667083]  ? show_regs+0x6d/0x80
[ 4455.667732]  ? watchdog_timer_fn+0x206/0x290
[ 4455.668378]  ? __pfx_watchdog_timer_fn+0x10/0x10
[ 4455.669028]  ? __hrtimer_run_queues+0x105/0x280
[ 4455.669687]  ? clockevents_program_event+0xb3/0x140
[ 4455.670335]  ? hrtimer_interrupt+0xf6/0x250
[ 4455.670983]  ? __sysvec_apic_timer_interrupt+0x4e/0x150
[ 4455.671632]  ? sysvec_apic_timer_interrupt+0x8d/0xd0
[ 4455.672282]  </IRQ>
[ 4455.672929]  <TASK>
[ 4455.673573]  ? asm_sysvec_apic_timer_interrupt+0x1b/0x20
[ 4455.674225]  ? native_queued_spin_lock_slowpath+0x7f/0x2d0
[ 4455.674876]  _raw_spin_lock+0x3f/0x60
[ 4455.675522]  __pte_offset_map_lock+0xa3/0x130
[ 4455.676171]  unmap_page_range+0x4b0/0x12e0
[ 4455.676826]  unmap_single_vma+0x89/0xf0
[ 4455.677470]  unmap_vmas+0xb5/0x190
[ 4455.678121]  exit_mmap+0x10a/0x3f0
[ 4455.678772]  __mmput+0x41/0x140
[ 4455.679416]  mmput+0x31/0x40
[ 4455.680068]  do_exit+0x32c/0xaf0
[ 4455.680718]  ? _printk+0x60/0x90
[ 4455.681363]  make_task_dead+0x83/0x170
[ 4455.682009]  rewind_stack_and_make_dead+0x17/0x20
[ 4455.682660] RIP: 0033:0x5942b512adfd
[ 4455.683310] Code: Unable to access opcode bytes at 0x5942b512add3.
[ 4455.683958] RSP: 002b:00007ffdb6303b90 EFLAGS: 00010206
[ 4455.684603] RAX: 0000000018054403 RBX: 00005942cf0cd2a0 RCX: 0000000000000000
[ 4455.685250] RDX: 00005942cf0d53f4 RSI: 00005942d0363b38 RDI: 00005942cf0cd2a0
[ 4455.685897] RBP: 00005942d50096f8 R08: 00005942cf403758 R09: 00005942d50096f0
[ 4455.686542] R10: 00005942d0363a90 R11: 00007ffdb6303aa4 R12: 00005942d50096f0
[ 4455.687194] R13: 0000000000000039 R14: 00005942d5009708 R15: 00005942cf414c28
[ 4455.687846]  </TASK>
 
kernel: ceph: No mds server is up or the cluster is laggy

So... check your MGR. Make sure they can communicate flawlessly. (Read: check congestion on the network.)

Sorry, I do not see the exact problem-trigger.

General advise: you have three nodes and one OSD each. That is the absolute minimum for Ceph to work as designed. As soon as anything fails your system is degraded - and stays degraded as there is no redundancy for Ceph to work with. To have a reliably Ceph system you need more...

Some hints: https://forum.proxmox.com/threads/fabu-can-i-use-ceph-in-a-_very_-small-cluster.159671/