Greetings,
First, thank you for PDM, this is a great and useful idea!
I tried it since the alpha release, but I have an issue that still persists in the beta. I believe it is a bug, but I might be doing something wrong.
The issue is very specific and is only affecting the Dashboard: Guests With the Highest CPU Usage, Nodes With the Highest CPU Usage, Nodes With the Highest Memory Usage panels and the section SDN: EVPN , returning an api error (status = 403: permission check failed). All the rest works fine.
When I am logged-in as root@pdm, I don't have the issue, the three panels mentioned above in the Dashboard show statistics, and the EVPN page are not returning the error.
But I have the issue when I am logged as my user @pdm (user having all permissions and propagation on / as an Administrator).
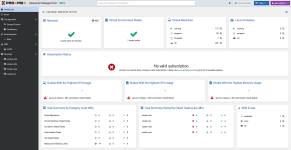
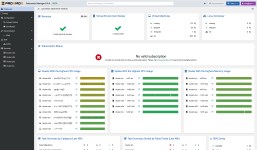
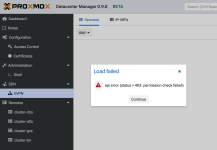
This is very specific as I mentioned, as other statistics, and clicking on Remotes clusters pages (as pdm user) is showing all nodes and VMs and stats without issues.
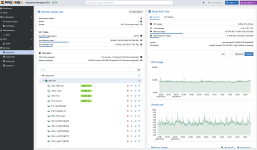
The access to the cluster is using a PVE user with all permissions.


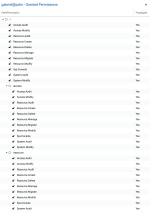
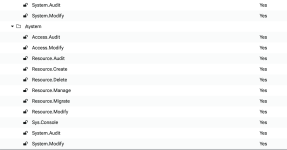
On the PDM device, in the logs, I don't find anything related to these 403:
Thank you for looking into this.
Regards,
Gabriel
First, thank you for PDM, this is a great and useful idea!
I tried it since the alpha release, but I have an issue that still persists in the beta. I believe it is a bug, but I might be doing something wrong.
The issue is very specific and is only affecting the Dashboard: Guests With the Highest CPU Usage, Nodes With the Highest CPU Usage, Nodes With the Highest Memory Usage panels and the section SDN: EVPN , returning an api error (status = 403: permission check failed). All the rest works fine.
When I am logged-in as root@pdm, I don't have the issue, the three panels mentioned above in the Dashboard show statistics, and the EVPN page are not returning the error.
But I have the issue when I am logged as my user @pdm (user having all permissions and propagation on / as an Administrator).


This is very specific as I mentioned, as other statistics, and clicking on Remotes clusters pages (as pdm user) is showing all nodes and VMs and stats without issues.

The access to the cluster is using a PVE user with all permissions.


On the PDM device, in the logs, I don't find anything related to these 403:
- nginx logs (for the reverse proxy) only shows GET /api2/extjs/nodes/localhost/tasks… and GET /api2/extjs/remote-tasks/list… returning HTTP 200, no errors.
- proxmox-datacenter-api.service and proxmox-datacenter-privileged-api.service show no errors.
Thank you for looking into this.
Regards,
Gabriel


