PBS datastore space usage increasing at an accelerated rate after GC.

DieselDrax

New Member
Jun 29, 2024
7
4
3
So, I've been using PBS to back up VMs and containers for about 2 months, initially I had just been doing backups and letting PBS handle making them incremental. Everything was great, no problems, space usage was tracking with the slow rate of data changes. So, then I decided to enable and run GC and verify jobs since that seemed like the Right Thing(tm) to do. Wellll...you can see in the image below what happened/is happening. Nothing has materially changed with any of the VMs or containers, this is all the result of GC. I'm not sure what GC did or if there's an easy way to undo it besides wiping all the backups and starting over again, making sure to not run any GC jobs.

Maybe I'm being ignorant about something and if so please educate me. At this point I just want to get back to the pre-GC state.

Screenshot 2024-08-07 094633.png
 
So, I've been using PBS to back up VMs and containers for about 2 months, initially I had just been doing backups and letting PBS handle making them incremental. Everything was great, no problems, space usage was tracking with the slow rate of data changes. So, then I decided to enable and run GC and verify jobs since that seemed like the Right Thing(tm) to do. Wellll...you can see in the image below what happened/is happening. Nothing has materially changed with any of the VMs or containers, this is all the result of GC. I'm not sure what GC did or if there's an easy way to undo it besides wiping all the backups and starting over again, making sure to not run any GC jobs.

Maybe I'm being ignorant about something and if so please educate me. At this point I just want to get back to the pre-GC state.

View attachment 72579
Hi,

please post the full tasklog of the last garbage collection job as well as the output of proxmox-backup-manager version --verbose. Also a task log of a backup run might be of interest, to see how much new data is getting written.

Further, can you exclude that something else is eating up the space on the storage backing this datastore? Maybe you can check with tools such as ncdu to see what is taking up the storage space.

The datatstore storage is a dedicated zpool only for backups, nothing else. This change in pattern started with the first post-GC backups.

Code:
root@pve:~# proxmox-backup-manager version --verbose
proxmox-backup                    unknown      running kernel: 6.8.8-3-pve
proxmox-backup-server             3.2.7-1      running version: 3.2.7
proxmox-kernel-helper             8.1.0
proxmox-kernel-6.8                6.8.12-1
proxmox-kernel-6.8.8-3-pve-signed 6.8.8-3
proxmox-kernel-6.8.8-2-pve-signed 6.8.8-2
proxmox-kernel-6.8.4-2-pve-signed 6.8.4-2
ifupdown2                         3.2.0-1+pmx9
libjs-extjs                       7.0.0-4
proxmox-backup-docs               3.2.7-1
proxmox-backup-client             3.2.7-1
proxmox-mail-forward              0.2.3
proxmox-mini-journalreader        1.4.0
proxmox-offline-mirror-helper     0.6.6
proxmox-widget-toolkit            4.2.3
pve-xtermjs                       5.3.0-3
smartmontools                     7.3-pve1
zfsutils-linux                    2.2.4-pve1

For the last GC logged there was little to do as I manually ran a GC earlier in the day and then enabled daily GC jobs. The manual run earlier in the day ended up freeing close to 2TB of space as it had been maybe 1-1.5 weeks since the last GC. The "fix" here may simply be to do more frequent QC, but I'm just left wondering why pre-GC space use and growth was so much better than after running/enabling GC jobs. It's almost as if GC breaks incremental backups.

Code:
2024-08-08T00:00:00-05:00: starting garbage collection on store backups
2024-08-08T00:00:00-05:00: task triggered by schedule 'daily'
2024-08-08T00:00:00-05:00: Start GC phase1 (mark used chunks)
2024-08-08T00:00:14-05:00: marked 1% (4 of 325 index files)
2024-08-08T00:00:19-05:00: marked 2% (7 of 325 index files)
2024-08-08T00:00:20-05:00: marked 3% (10 of 325 index files)
2024-08-08T00:00:20-05:00: marked 4% (13 of 325 index files)
2024-08-08T00:00:21-05:00: marked 5% (17 of 325 index files)
2024-08-08T00:00:21-05:00: marked 6% (20 of 325 index files)
2024-08-08T00:00:26-05:00: marked 7% (23 of 325 index files)
2024-08-08T00:00:26-05:00: marked 8% (26 of 325 index files)
2024-08-08T00:11:48-05:00: marked 9% (30 of 325 index files)
2024-08-08T00:11:50-05:00: marked 10% (33 of 325 index files)
2024-08-08T00:11:50-05:00: marked 11% (36 of 325 index files)
2024-08-08T00:11:51-05:00: marked 12% (39 of 325 index files)
2024-08-08T00:11:56-05:00: marked 13% (43 of 325 index files)
2024-08-08T00:11:56-05:00: marked 14% (46 of 325 index files)
2024-08-08T00:11:57-05:00: marked 15% (49 of 325 index files)
2024-08-08T00:11:59-05:00: marked 16% (52 of 325 index files)
2024-08-08T00:12:08-05:00: marked 17% (56 of 325 index files)
2024-08-08T00:12:10-05:00: marked 18% (59 of 325 index files)
2024-08-08T00:12:16-05:00: marked 19% (62 of 325 index files)
2024-08-08T00:12:20-05:00: marked 20% (65 of 325 index files)
2024-08-08T00:12:23-05:00: marked 21% (69 of 325 index files)
2024-08-08T00:12:27-05:00: marked 22% (72 of 325 index files)
2024-08-08T00:12:29-05:00: marked 23% (75 of 325 index files)
2024-08-08T00:12:31-05:00: marked 24% (78 of 325 index files)
2024-08-08T00:13:53-05:00: marked 25% (82 of 325 index files)
2024-08-08T00:13:54-05:00: marked 26% (85 of 325 index files)
2024-08-08T00:13:55-05:00: marked 27% (88 of 325 index files)
2024-08-08T00:14:02-05:00: marked 28% (91 of 325 index files)
2024-08-08T00:14:07-05:00: marked 29% (95 of 325 index files)
2024-08-08T00:14:10-05:00: marked 30% (98 of 325 index files)
2024-08-08T00:14:13-05:00: marked 31% (101 of 325 index files)
2024-08-08T00:14:14-05:00: marked 32% (104 of 325 index files)
2024-08-08T00:14:17-05:00: marked 33% (108 of 325 index files)
2024-08-08T00:14:18-05:00: marked 34% (111 of 325 index files)
2024-08-08T00:14:18-05:00: marked 35% (114 of 325 index files)
2024-08-08T00:14:18-05:00: marked 36% (117 of 325 index files)
2024-08-08T00:14:19-05:00: marked 37% (121 of 325 index files)
2024-08-08T00:14:19-05:00: marked 38% (124 of 325 index files)
2024-08-08T00:14:20-05:00: marked 39% (127 of 325 index files)
2024-08-08T00:14:21-05:00: marked 40% (130 of 325 index files)
2024-08-08T00:14:46-05:00: marked 41% (134 of 325 index files)
2024-08-08T00:14:50-05:00: marked 42% (137 of 325 index files)
2024-08-08T00:14:50-05:00: marked 43% (140 of 325 index files)
2024-08-08T00:14:51-05:00: marked 44% (143 of 325 index files)
2024-08-08T00:14:51-05:00: marked 45% (147 of 325 index files)
2024-08-08T00:14:51-05:00: marked 46% (150 of 325 index files)
2024-08-08T00:14:52-05:00: marked 47% (153 of 325 index files)
2024-08-08T00:14:52-05:00: marked 48% (156 of 325 index files)
2024-08-08T00:15:21-05:00: marked 49% (160 of 325 index files)
2024-08-08T00:15:23-05:00: marked 50% (163 of 325 index files)
2024-08-08T00:15:25-05:00: marked 51% (166 of 325 index files)
2024-08-08T00:15:25-05:00: marked 52% (169 of 325 index files)
2024-08-08T00:15:28-05:00: marked 53% (173 of 325 index files)
2024-08-08T00:15:28-05:00: marked 54% (176 of 325 index files)
2024-08-08T00:15:31-05:00: marked 55% (179 of 325 index files)
2024-08-08T00:15:34-05:00: marked 56% (182 of 325 index files)
2024-08-08T00:16:42-05:00: marked 57% (186 of 325 index files)
2024-08-08T00:16:54-05:00: marked 58% (189 of 325 index files)
2024-08-08T00:17:12-05:00: marked 59% (192 of 325 index files)
2024-08-08T00:17:24-05:00: marked 60% (195 of 325 index files)
2024-08-08T00:17:28-05:00: marked 61% (199 of 325 index files)
2024-08-08T00:17:47-05:00: marked 62% (202 of 325 index files)
2024-08-08T00:17:52-05:00: marked 63% (205 of 325 index files)
2024-08-08T00:18:12-05:00: marked 64% (208 of 325 index files)
2024-08-08T00:18:44-05:00: marked 65% (212 of 325 index files)
2024-08-08T00:18:50-05:00: marked 66% (215 of 325 index files)
2024-08-08T00:18:51-05:00: marked 67% (218 of 325 index files)
2024-08-08T00:18:51-05:00: marked 68% (221 of 325 index files)
2024-08-08T00:18:54-05:00: marked 69% (225 of 325 index files)
2024-08-08T00:18:57-05:00: marked 70% (228 of 325 index files)
2024-08-08T00:18:59-05:00: marked 71% (231 of 325 index files)
2024-08-08T00:19:00-05:00: marked 72% (234 of 325 index files)
2024-08-08T00:29:41-05:00: marked 73% (238 of 325 index files)
2024-08-08T00:30:35-05:00: marked 74% (241 of 325 index files)
2024-08-08T00:30:35-05:00: marked 75% (244 of 325 index files)
2024-08-08T00:31:14-05:00: marked 76% (247 of 325 index files)
2024-08-08T00:31:25-05:00: marked 77% (251 of 325 index files)
2024-08-08T00:31:25-05:00: marked 78% (254 of 325 index files)
2024-08-08T00:31:30-05:00: marked 79% (257 of 325 index files)
2024-08-08T00:31:34-05:00: marked 80% (260 of 325 index files)
2024-08-08T00:31:36-05:00: marked 81% (264 of 325 index files)
2024-08-08T00:31:42-05:00: marked 82% (267 of 325 index files)
2024-08-08T00:31:49-05:00: marked 83% (270 of 325 index files)
2024-08-08T00:31:55-05:00: marked 84% (273 of 325 index files)
2024-08-08T00:32:25-05:00: marked 85% (277 of 325 index files)
2024-08-08T00:33:11-05:00: marked 86% (280 of 325 index files)
2024-08-08T00:33:36-05:00: marked 87% (283 of 325 index files)
2024-08-08T00:34:15-05:00: marked 88% (286 of 325 index files)
2024-08-08T00:34:15-05:00: marked 89% (290 of 325 index files)
2024-08-08T00:34:34-05:00: marked 90% (293 of 325 index files)
2024-08-08T00:35:10-05:00: marked 91% (296 of 325 index files)
2024-08-08T00:35:17-05:00: marked 92% (299 of 325 index files)
2024-08-08T00:35:23-05:00: marked 93% (303 of 325 index files)
2024-08-08T00:35:34-05:00: marked 94% (306 of 325 index files)
2024-08-08T00:35:36-05:00: marked 95% (309 of 325 index files)
2024-08-08T00:35:45-05:00: marked 96% (312 of 325 index files)
2024-08-08T00:36:01-05:00: marked 97% (316 of 325 index files)
2024-08-08T00:36:05-05:00: marked 98% (319 of 325 index files)
2024-08-08T00:36:09-05:00: marked 99% (322 of 325 index files)
2024-08-08T00:36:12-05:00: marked 100% (325 of 325 index files)
2024-08-08T00:36:12-05:00: Start GC phase2 (sweep unused chunks)
2024-08-08T00:36:12-05:00: processed 1% (9325 chunks)
2024-08-08T00:36:12-05:00: processed 2% (18712 chunks)
2024-08-08T00:36:13-05:00: processed 3% (27902 chunks)
2024-08-08T00:36:13-05:00: processed 4% (37266 chunks)
2024-08-08T00:36:13-05:00: processed 5% (46600 chunks)
2024-08-08T00:36:13-05:00: processed 6% (55876 chunks)
2024-08-08T00:36:14-05:00: processed 7% (65105 chunks)
2024-08-08T00:36:15-05:00: processed 8% (74421 chunks)
2024-08-08T00:36:15-05:00: processed 9% (83724 chunks)
2024-08-08T00:36:15-05:00: processed 10% (93208 chunks)
2024-08-08T00:36:15-05:00: processed 11% (102595 chunks)
2024-08-08T00:36:16-05:00: processed 12% (112009 chunks)
2024-08-08T00:36:17-05:00: processed 13% (121427 chunks)
2024-08-08T00:36:17-05:00: processed 14% (130820 chunks)
2024-08-08T00:36:18-05:00: processed 15% (140293 chunks)
2024-08-08T00:36:19-05:00: processed 16% (149695 chunks)
2024-08-08T00:36:19-05:00: processed 17% (159091 chunks)
2024-08-08T00:36:20-05:00: processed 18% (168433 chunks)
2024-08-08T00:36:21-05:00: processed 19% (177731 chunks)
2024-08-08T00:36:21-05:00: processed 20% (187136 chunks)
2024-08-08T00:36:22-05:00: processed 21% (196356 chunks)
2024-08-08T00:36:22-05:00: processed 22% (205642 chunks)
2024-08-08T00:36:23-05:00: processed 23% (214992 chunks)
2024-08-08T00:36:24-05:00: processed 24% (224290 chunks)
2024-08-08T00:36:25-05:00: processed 25% (233542 chunks)
2024-08-08T00:36:26-05:00: processed 26% (242886 chunks)
2024-08-08T00:36:26-05:00: processed 27% (252388 chunks)
2024-08-08T00:36:27-05:00: processed 28% (261783 chunks)
2024-08-08T00:36:28-05:00: processed 29% (271171 chunks)
2024-08-08T00:36:29-05:00: processed 30% (280404 chunks)
2024-08-08T00:36:30-05:00: processed 31% (289890 chunks)
2024-08-08T00:36:30-05:00: processed 32% (299351 chunks)
2024-08-08T00:36:31-05:00: processed 33% (308698 chunks)
2024-08-08T00:36:31-05:00: processed 34% (318207 chunks)
2024-08-08T00:36:32-05:00: processed 35% (327429 chunks)
2024-08-08T00:36:33-05:00: processed 36% (336788 chunks)
2024-08-08T00:36:33-05:00: processed 37% (346190 chunks)
2024-08-08T00:36:34-05:00: processed 38% (355546 chunks)
2024-08-08T00:36:34-05:00: processed 39% (365015 chunks)
2024-08-08T00:36:35-05:00: processed 40% (374265 chunks)
2024-08-08T00:36:36-05:00: processed 41% (383709 chunks)
2024-08-08T00:36:36-05:00: processed 42% (393017 chunks)
2024-08-08T00:36:37-05:00: processed 43% (402162 chunks)
2024-08-08T00:36:38-05:00: processed 44% (411387 chunks)
2024-08-08T00:36:38-05:00: processed 45% (420781 chunks)
2024-08-08T00:36:39-05:00: processed 46% (430187 chunks)
2024-08-08T00:36:40-05:00: processed 47% (439490 chunks)
2024-08-08T00:36:40-05:00: processed 48% (449027 chunks)
2024-08-08T00:36:41-05:00: processed 49% (458383 chunks)
2024-08-08T00:36:41-05:00: processed 50% (467731 chunks)
2024-08-08T00:36:42-05:00: processed 51% (476978 chunks)
2024-08-08T00:36:43-05:00: processed 52% (486124 chunks)
2024-08-08T00:36:43-05:00: processed 53% (495622 chunks)
2024-08-08T00:36:44-05:00: processed 54% (505104 chunks)
2024-08-08T00:36:45-05:00: processed 55% (514469 chunks)
2024-08-08T00:36:45-05:00: processed 56% (523791 chunks)
2024-08-08T00:36:46-05:00: processed 57% (533139 chunks)
2024-08-08T00:36:47-05:00: processed 58% (542201 chunks)
2024-08-08T00:36:47-05:00: processed 59% (551666 chunks)
2024-08-08T00:36:48-05:00: processed 60% (561158 chunks)
2024-08-08T00:36:49-05:00: processed 61% (570770 chunks)
2024-08-08T00:36:49-05:00: processed 62% (580260 chunks)
2024-08-08T00:36:50-05:00: processed 63% (589712 chunks)
2024-08-08T00:36:51-05:00: processed 64% (598998 chunks)
2024-08-08T00:36:51-05:00: processed 65% (608216 chunks)
2024-08-08T00:36:52-05:00: processed 66% (617600 chunks)
2024-08-08T00:36:53-05:00: processed 67% (626891 chunks)
2024-08-08T00:36:53-05:00: processed 68% (636402 chunks)
2024-08-08T00:36:54-05:00: processed 69% (645779 chunks)
2024-08-08T00:36:55-05:00: processed 70% (655031 chunks)
2024-08-08T00:36:55-05:00: processed 71% (664398 chunks)
2024-08-08T00:36:56-05:00: processed 72% (673834 chunks)
2024-08-08T00:36:57-05:00: processed 73% (683431 chunks)
2024-08-08T00:36:57-05:00: processed 74% (692769 chunks)
2024-08-08T00:36:58-05:00: processed 75% (701875 chunks)
2024-08-08T00:36:59-05:00: processed 76% (711303 chunks)
2024-08-08T00:36:59-05:00: processed 77% (720756 chunks)
2024-08-08T00:37:00-05:00: processed 78% (730129 chunks)
2024-08-08T00:37:01-05:00: processed 79% (739472 chunks)
2024-08-08T00:37:02-05:00: processed 80% (748846 chunks)
2024-08-08T00:37:02-05:00: processed 81% (758094 chunks)
2024-08-08T00:37:03-05:00: processed 82% (767507 chunks)
2024-08-08T00:37:03-05:00: processed 83% (776858 chunks)
2024-08-08T00:37:04-05:00: processed 84% (786242 chunks)
2024-08-08T00:37:05-05:00: processed 85% (795371 chunks)
2024-08-08T00:37:06-05:00: processed 86% (804788 chunks)
2024-08-08T00:37:06-05:00: processed 87% (814172 chunks)
2024-08-08T00:37:07-05:00: processed 88% (823312 chunks)
2024-08-08T00:37:07-05:00: processed 89% (832760 chunks)
2024-08-08T00:37:08-05:00: processed 90% (842049 chunks)
2024-08-08T00:37:09-05:00: processed 91% (851418 chunks)
2024-08-08T00:37:09-05:00: processed 92% (860885 chunks)
2024-08-08T00:37:10-05:00: processed 93% (870222 chunks)
2024-08-08T00:37:11-05:00: processed 94% (879507 chunks)
2024-08-08T00:37:11-05:00: processed 95% (888831 chunks)
2024-08-08T00:37:12-05:00: processed 96% (897986 chunks)
2024-08-08T00:37:12-05:00: processed 97% (907278 chunks)
2024-08-08T00:37:13-05:00: processed 98% (916718 chunks)
2024-08-08T00:37:14-05:00: processed 99% (926069 chunks)
2024-08-08T00:37:14-05:00: Removed garbage: 0 B
2024-08-08T00:37:14-05:00: Removed chunks: 0
2024-08-08T00:37:14-05:00: Original data usage: 28.547 TiB
2024-08-08T00:37:14-05:00: On-Disk usage: 2.949 TiB (10.33%)
2024-08-08T00:37:14-05:00: On-Disk chunks: 935326
2024-08-08T00:37:14-05:00: Deduplication factor: 9.68
2024-08-08T00:37:14-05:00: Average chunk size: 3.306 MiB
2024-08-08T00:37:14-05:00: TASK OK
 
Backup of one of the larger VMs

Code:
INFO: VM Name: WGS-W11-01
INFO: include disk 'virtio0' 'rpool:vm-101-disk-5' 1000G
INFO: include disk 'efidisk0' 'rpool:vm-101-disk-6' 528K
INFO: include disk 'tpmstate0' 'rpool:vm-101-disk-7' 4M
INFO: backup mode: snapshot
INFO: ionice priority: 7
INFO: snapshots found (not included into backup)
INFO: creating Proxmox Backup Server archive 'vm/101/2024-08-08T07:21:20Z'
INFO: attaching TPM drive to QEMU for backup
INFO: issuing guest-agent 'fs-freeze' command
INFO: issuing guest-agent 'fs-thaw' command
INFO: started backup task '28820168-d87e-4d2d-b2f7-730afdca06df'
INFO: resuming VM again
INFO: efidisk0: dirty-bitmap status: OK (drive clean)
INFO: tpmstate0-backup: dirty-bitmap status: created new
INFO: virtio0: dirty-bitmap status: OK (278.5 GiB of 1000.0 GiB dirty)
INFO: using fast incremental mode (dirty-bitmap), 278.5 GiB dirty of 1000.0 GiB total
INFO:   0% (1.8 GiB of 278.5 GiB) in 3s, read: 630.7 MiB/s, write: 609.3 MiB/s
INFO:   1% (3.6 GiB of 278.5 GiB) in 6s, read: 597.3 MiB/s, write: 529.3 MiB/s
INFO:   2% (5.8 GiB of 278.5 GiB) in 9s, read: 740.0 MiB/s, write: 520.0 MiB/s
INFO:   3% (9.3 GiB of 278.5 GiB) in 12s, read: 1.2 GiB/s, write: 742.7 MiB/s
INFO:   4% (11.3 GiB of 278.5 GiB) in 18s, read: 340.0 MiB/s, write: 333.3 MiB/s
INFO:   5% (14.1 GiB of 278.5 GiB) in 37s, read: 149.3 MiB/s, write: 149.3 MiB/s
INFO:   6% (17.0 GiB of 278.5 GiB) in 55s, read: 166.2 MiB/s, write: 164.4 MiB/s
INFO:   7% (19.6 GiB of 278.5 GiB) in 1m 5s, read: 272.8 MiB/s, write: 270.8 MiB/s
INFO:   8% (22.4 GiB of 278.5 GiB) in 1m 17s, read: 231.3 MiB/s, write: 231.3 MiB/s
INFO:   9% (25.2 GiB of 278.5 GiB) in 1m 35s, read: 161.1 MiB/s, write: 161.1 MiB/s
INFO:  10% (27.9 GiB of 278.5 GiB) in 1m 52s, read: 164.5 MiB/s, write: 164.2 MiB/s
INFO:  11% (30.7 GiB of 278.5 GiB) in 2m 11s, read: 152.4 MiB/s, write: 152.4 MiB/s
INFO:  12% (33.5 GiB of 278.5 GiB) in 2m 29s, read: 156.7 MiB/s, write: 156.7 MiB/s
INFO:  13% (36.3 GiB of 278.5 GiB) in 2m 46s, read: 167.8 MiB/s, write: 163.8 MiB/s
INFO:  14% (39.0 GiB of 278.5 GiB) in 3m 3s, read: 164.7 MiB/s, write: 164.7 MiB/s
INFO:  15% (41.8 GiB of 278.5 GiB) in 3m 20s, read: 168.2 MiB/s, write: 167.1 MiB/s
INFO:  16% (44.7 GiB of 278.5 GiB) in 3m 38s, read: 164.0 MiB/s, write: 164.0 MiB/s
INFO:  17% (47.5 GiB of 278.5 GiB) in 3m 55s, read: 166.6 MiB/s, write: 166.6 MiB/s
INFO:  18% (50.2 GiB of 278.5 GiB) in 4m 13s, read: 154.4 MiB/s, write: 154.0 MiB/s
INFO:  19% (53.1 GiB of 278.5 GiB) in 4m 20s, read: 425.7 MiB/s, write: 156.6 MiB/s
INFO:  20% (55.8 GiB of 278.5 GiB) in 4m 36s, read: 173.5 MiB/s, write: 173.5 MiB/s
INFO:  21% (58.6 GiB of 278.5 GiB) in 4m 51s, read: 193.1 MiB/s, write: 159.7 MiB/s
INFO:  22% (61.3 GiB of 278.5 GiB) in 5m 7s, read: 172.0 MiB/s, write: 172.0 MiB/s
INFO:  23% (64.1 GiB of 278.5 GiB) in 5m 25s, read: 160.4 MiB/s, write: 160.4 MiB/s
INFO:  24% (66.9 GiB of 278.5 GiB) in 5m 42s, read: 165.4 MiB/s, write: 157.4 MiB/s
INFO:  25% (69.8 GiB of 278.5 GiB) in 6m 1s, read: 158.3 MiB/s, write: 157.9 MiB/s
INFO:  26% (72.5 GiB of 278.5 GiB) in 6m 19s, read: 153.1 MiB/s, write: 153.1 MiB/s
INFO:  27% (75.3 GiB of 278.5 GiB) in 6m 37s, read: 158.0 MiB/s, write: 157.1 MiB/s
INFO:  28% (78.1 GiB of 278.5 GiB) in 6m 55s, read: 161.1 MiB/s, write: 158.4 MiB/s
INFO:  29% (81.0 GiB of 278.5 GiB) in 7m 14s, read: 154.1 MiB/s, write: 150.1 MiB/s
INFO:  30% (83.7 GiB of 278.5 GiB) in 7m 33s, read: 148.0 MiB/s, write: 146.1 MiB/s
INFO:  31% (86.6 GiB of 278.5 GiB) in 7m 53s, read: 149.4 MiB/s, write: 144.6 MiB/s
INFO:  32% (89.5 GiB of 278.5 GiB) in 8m 12s, read: 154.7 MiB/s, write: 152.4 MiB/s
INFO:  33% (91.9 GiB of 278.5 GiB) in 8m 30s, read: 137.1 MiB/s, write: 133.3 MiB/s
INFO:  34% (94.8 GiB of 278.5 GiB) in 8m 50s, read: 148.2 MiB/s, write: 144.8 MiB/s
INFO:  35% (97.5 GiB of 278.5 GiB) in 9m 16s, read: 104.9 MiB/s, write: 97.2 MiB/s
INFO:  36% (100.4 GiB of 278.5 GiB) in 9m 40s, read: 123.0 MiB/s, write: 114.0 MiB/s
INFO:  37% (103.1 GiB of 278.5 GiB) in 10m 2s, read: 126.9 MiB/s, write: 120.2 MiB/s
INFO:  38% (106.0 GiB of 278.5 GiB) in 10m 32s, read: 98.5 MiB/s, write: 90.4 MiB/s
INFO:  39% (108.7 GiB of 278.5 GiB) in 11m 4s, read: 86.5 MiB/s, write: 83.5 MiB/s
INFO:  40% (111.6 GiB of 278.5 GiB) in 11m 26s, read: 134.0 MiB/s, write: 133.8 MiB/s
INFO:  41% (114.3 GiB of 278.5 GiB) in 11m 47s, read: 132.4 MiB/s, write: 126.9 MiB/s
INFO:  42% (117.2 GiB of 278.5 GiB) in 12m 9s, read: 134.9 MiB/s, write: 128.7 MiB/s
INFO:  43% (119.8 GiB of 278.5 GiB) in 12m 40s, read: 88.0 MiB/s, write: 78.3 MiB/s
INFO:  44% (122.6 GiB of 278.5 GiB) in 12m 58s, read: 155.3 MiB/s, write: 147.6 MiB/s
INFO:  45% (125.5 GiB of 278.5 GiB) in 13m 16s, read: 164.4 MiB/s, write: 156.2 MiB/s
INFO:  46% (128.3 GiB of 278.5 GiB) in 13m 35s, read: 151.2 MiB/s, write: 147.8 MiB/s
INFO:  47% (131.0 GiB of 278.5 GiB) in 13m 54s, read: 148.2 MiB/s, write: 148.2 MiB/s
INFO:  48% (133.7 GiB of 278.5 GiB) in 14m 16s, read: 125.1 MiB/s, write: 124.7 MiB/s
INFO:  49% (136.5 GiB of 278.5 GiB) in 14m 33s, read: 168.5 MiB/s, write: 165.6 MiB/s
INFO:  50% (139.3 GiB of 278.5 GiB) in 14m 54s, read: 135.0 MiB/s, write: 134.9 MiB/s
INFO:  51% (142.2 GiB of 278.5 GiB) in 15m 12s, read: 166.9 MiB/s, write: 159.3 MiB/s
INFO:  52% (144.9 GiB of 278.5 GiB) in 15m 30s, read: 153.1 MiB/s, write: 151.8 MiB/s
INFO:  53% (147.6 GiB of 278.5 GiB) in 15m 49s, read: 147.2 MiB/s, write: 147.2 MiB/s
INFO:  54% (150.4 GiB of 278.5 GiB) in 16m 9s, read: 143.2 MiB/s, write: 142.2 MiB/s
INFO:  55% (153.3 GiB of 278.5 GiB) in 16m 26s, read: 171.8 MiB/s, write: 169.4 MiB/s
INFO:  56% (156.0 GiB of 278.5 GiB) in 16m 43s, read: 167.5 MiB/s, write: 166.8 MiB/s
INFO:  57% (158.8 GiB of 278.5 GiB) in 17m 1s, read: 156.9 MiB/s, write: 155.6 MiB/s
INFO:  58% (161.6 GiB of 278.5 GiB) in 17m 20s, read: 148.6 MiB/s, write: 148.6 MiB/s
INFO:  59% (164.4 GiB of 278.5 GiB) in 17m 39s, read: 152.8 MiB/s, write: 152.6 MiB/s
INFO:  60% (167.2 GiB of 278.5 GiB) in 17m 57s, read: 156.7 MiB/s, write: 156.7 MiB/s
INFO:  61% (170.0 GiB of 278.5 GiB) in 18m 16s, read: 154.3 MiB/s, write: 154.3 MiB/s
INFO:  62% (172.7 GiB of 278.5 GiB) in 18m 35s, read: 144.8 MiB/s, write: 144.2 MiB/s
INFO:  63% (175.5 GiB of 278.5 GiB) in 18m 54s, read: 152.6 MiB/s, write: 149.3 MiB/s
INFO:  64% (178.4 GiB of 278.5 GiB) in 19m 13s, read: 153.7 MiB/s, write: 150.7 MiB/s
INFO:  65% (181.1 GiB of 278.5 GiB) in 19m 32s, read: 144.6 MiB/s, write: 140.4 MiB/s
INFO:  66% (184.1 GiB of 278.5 GiB) in 19m 53s, read: 146.5 MiB/s, write: 145.0 MiB/s
INFO:  67% (186.8 GiB of 278.5 GiB) in 20m 12s, read: 144.8 MiB/s, write: 144.6 MiB/s
INFO:  68% (189.5 GiB of 278.5 GiB) in 20m 31s, read: 148.4 MiB/s, write: 147.4 MiB/s
INFO:  69% (192.2 GiB of 278.5 GiB) in 20m 51s, read: 137.2 MiB/s, write: 137.2 MiB/s
INFO:  70% (195.1 GiB of 278.5 GiB) in 21m 12s, read: 139.8 MiB/s, write: 139.0 MiB/s
INFO:  71% (197.8 GiB of 278.5 GiB) in 21m 30s, read: 155.3 MiB/s, write: 155.3 MiB/s
INFO:  72% (200.6 GiB of 278.5 GiB) in 21m 52s, read: 132.7 MiB/s, write: 132.7 MiB/s
INFO:  73% (203.3 GiB of 278.5 GiB) in 22m 13s, read: 131.2 MiB/s, write: 131.2 MiB/s
INFO:  74% (206.2 GiB of 278.5 GiB) in 22m 35s, read: 132.2 MiB/s, write: 131.6 MiB/s
INFO:  75% (209.2 GiB of 278.5 GiB) in 22m 57s, read: 142.5 MiB/s, write: 140.0 MiB/s
INFO:  76% (212.0 GiB of 278.5 GiB) in 23m 16s, read: 146.5 MiB/s, write: 144.6 MiB/s
INFO:  77% (214.5 GiB of 278.5 GiB) in 23m 36s, read: 131.8 MiB/s, write: 131.8 MiB/s
INFO:  78% (217.3 GiB of 278.5 GiB) in 23m 58s, read: 127.5 MiB/s, write: 126.5 MiB/s
INFO:  79% (220.1 GiB of 278.5 GiB) in 24m 24s, read: 110.8 MiB/s, write: 108.0 MiB/s
INFO:  80% (222.9 GiB of 278.5 GiB) in 24m 49s, read: 113.8 MiB/s, write: 112.6 MiB/s
INFO:  81% (225.7 GiB of 278.5 GiB) in 25m 16s, read: 109.2 MiB/s, write: 108.9 MiB/s
INFO:  82% (228.4 GiB of 278.5 GiB) in 25m 39s, read: 120.0 MiB/s, write: 114.3 MiB/s
INFO:  83% (231.2 GiB of 278.5 GiB) in 26m 4s, read: 111.7 MiB/s, write: 111.4 MiB/s
INFO:  84% (234.0 GiB of 278.5 GiB) in 26m 29s, read: 116.2 MiB/s, write: 115.0 MiB/s
INFO:  85% (236.8 GiB of 278.5 GiB) in 26m 55s, read: 109.5 MiB/s, write: 108.8 MiB/s
INFO:  86% (239.7 GiB of 278.5 GiB) in 27m 20s, read: 119.2 MiB/s, write: 119.2 MiB/s
INFO:  87% (242.3 GiB of 278.5 GiB) in 27m 46s, read: 104.6 MiB/s, write: 104.6 MiB/s
INFO:  88% (245.3 GiB of 278.5 GiB) in 28m 10s, read: 124.5 MiB/s, write: 124.5 MiB/s
INFO:  89% (247.9 GiB of 278.5 GiB) in 28m 34s, read: 113.5 MiB/s, write: 112.8 MiB/s
INFO:  90% (250.8 GiB of 278.5 GiB) in 28m 58s, read: 121.0 MiB/s, write: 120.7 MiB/s
INFO:  91% (253.5 GiB of 278.5 GiB) in 29m 23s, read: 111.0 MiB/s, write: 110.6 MiB/s
INFO:  92% (256.3 GiB of 278.5 GiB) in 29m 47s, read: 120.3 MiB/s, write: 115.5 MiB/s
INFO:  93% (259.2 GiB of 278.5 GiB) in 30m 9s, read: 135.1 MiB/s, write: 130.9 MiB/s
INFO:  94% (261.8 GiB of 278.5 GiB) in 30m 31s, read: 123.1 MiB/s, write: 122.0 MiB/s
INFO:  95% (264.7 GiB of 278.5 GiB) in 30m 53s, read: 131.5 MiB/s, write: 131.5 MiB/s
INFO:  96% (267.6 GiB of 278.5 GiB) in 31m 17s, read: 123.3 MiB/s, write: 123.3 MiB/s
INFO:  97% (270.2 GiB of 278.5 GiB) in 31m 41s, read: 114.5 MiB/s, write: 114.5 MiB/s
INFO:  98% (273.0 GiB of 278.5 GiB) in 32m 2s, read: 134.7 MiB/s, write: 133.7 MiB/s
INFO:  99% (275.8 GiB of 278.5 GiB) in 32m 26s, read: 117.5 MiB/s, write: 110.8 MiB/s
INFO: 100% (278.5 GiB of 278.5 GiB) in 32m 48s, read: 128.2 MiB/s, write: 123.3 MiB/s
INFO: backup is sparse: 6.04 GiB (2%) total zero data
INFO: backup was done incrementally, reused 730.17 GiB (73%)
INFO: transferred 278.50 GiB in 1975 seconds (144.4 MiB/s)
INFO: adding notes to backup
INFO: prune older backups with retention: keep-daily=7, keep-monthly=6, keep-weekly=4
INFO: running 'proxmox-backup-client prune' for 'vm/101'
INFO: pruned 1 backup(s) not covered by keep-retention policy
INFO: Finished Backup of VM 101 (00:32:56)
INFO: Backup finished at 2024-08-08 02:54:16
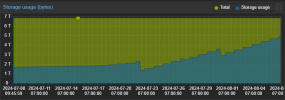
 
I'm an idiot.

At the time of the first GC those "steps" weren't obvious as they started a few days prior to the first GC, but I can correlate the timing with a change to what was running on one of the VMs so I now have the cause. Feel free to flog me as appropriate. :) Sorry for the false alarm.
 
I'm an idiot.

At the time of the first GC those "steps" weren't obvious as they started a few days prior to the first GC, but I can correlate the timing with a change to what was running on one of the VMs so I now have the cause. Feel free to flog me as appropriate. :) Sorry for the false alarm.
Well no worries, glad you found cause and everything works as expected ;)

On a side note: It might make sense to adapt the frequency of your garbage collection to how frequently you are pruning backups. If no snapshot index files are removed, the garbage collection will re-find the same indexed chunks, and nothing to clean up.
 
  • Like
Reactions: DieselDrax
Well no worries, glad you found cause and everything works as expected ;)

On a side note: It might make sense to adapt the frequency of your garbage collection to how frequently you are pruning backups. If no snapshot index files are removed, the garbage collection will re-find the same indexed chunks, and nothing to clean up.

I think the daily GC will work well here, since backups have been running for a while there's now a prune happening daily as I've set retention to keep 7 daily, 4 weekly, and 6 monthly backups. I'll let the daily GC bake for a couple of weeks while I'm out of town and re-evaluate when I'm back.

Thanks for your help and understanding! :)
 

About

The Proxmox community has been around for many years and offers help and support for Proxmox VE, Proxmox Backup Server, and Proxmox Mail Gateway.
We think our community is one of the best thanks to people like you!

Get your subscription!

The Proxmox team works very hard to make sure you are running the best software and getting stable updates and security enhancements, as well as quick enterprise support. Tens of thousands of happy customers have a Proxmox subscription. Get yours easily in our online shop.

Buy now!