I have moved my firewall/router to my main Proxmox host to save some energy. My main Proxmox host has an i5 14500 14C20T CPU (PL1 increased from 65w to 125w to sustain higher clocks) and 32GB DDR5 ECC. This runs a bunch of other stuff including the usual home server containers such as HA, Frigate, Jellyfin, a NAS and generally runs around 6-7% CPU with the background stuff it's running.
I've got the OPNsense VM configured as Q35/UEFI with host CPU type, 4 CPU cores, WAN bridged to one of the ethernet ports on the motherboard where my ONT is plugged in and the LAN is bridged to the one plugged into my switch. VirtIO devices in the VM are set to multiqueue = 4 thread. All hardware offloads are disabled in OPNsense.
I have some tunables set in OPNsense for multithreading etc and have no issues with performance and can max out my 1gbps connection. My connection is fibre and does not use PPPoE or VLAN tagging.
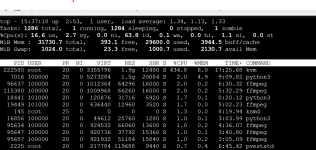
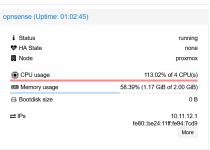
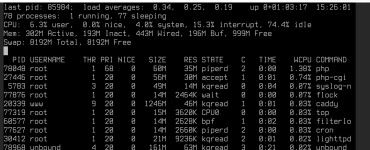
However when I am ultising 100% of my connection I see 4 cores maxed out on my host according to top. This pushes my host CPU from 6-7% up to about 30%. In the web GUI I see around 120% CPU on the VM, and inside the VM I see minimal CPU.
The other weird thing is it scales with CPU cores. With 2 CPU cores in the OPNsense VM I see 230% CPU on the kvm process and with 4 CPUs CPUs allocated I see 430%. The throughput remains the same whether I have 2 or 4 cores allocated.
I've also found it's pushing power consumption at the wall up from about 75w normal background load to about 130w (or 113w with 2 cores allocated) and can hear the CPU fan speed increase corresponding to the load. It's not just a reporting issue. When I was running it bare metal on my N100 box was 15w at idle at 15-16w at full throughput.
I disabled all the offloads with ethtool in the parent interfaces and the bridges in Proxmox but it didn't make any difference.
My NAS is a VM running Debian using the same VirtIO LAN bridge and I can push 2.3gbps/280MB/s to/from it without any unusual CPU load (just a bit of CPU for Samba in the VM) so this seems to be something specific to FreeBSD.
Top on the host:
OPNsense load in the GUI. 113% would correspond to all 4 of the allocated CPU cores at max load as seen above.
CPU within OPNsense itself is negligibe.
Any assistance would be greatly appreciated.
I've got the OPNsense VM configured as Q35/UEFI with host CPU type, 4 CPU cores, WAN bridged to one of the ethernet ports on the motherboard where my ONT is plugged in and the LAN is bridged to the one plugged into my switch. VirtIO devices in the VM are set to multiqueue = 4 thread. All hardware offloads are disabled in OPNsense.
I have some tunables set in OPNsense for multithreading etc and have no issues with performance and can max out my 1gbps connection. My connection is fibre and does not use PPPoE or VLAN tagging.
However when I am ultising 100% of my connection I see 4 cores maxed out on my host according to top. This pushes my host CPU from 6-7% up to about 30%. In the web GUI I see around 120% CPU on the VM, and inside the VM I see minimal CPU.
The other weird thing is it scales with CPU cores. With 2 CPU cores in the OPNsense VM I see 230% CPU on the kvm process and with 4 CPUs CPUs allocated I see 430%. The throughput remains the same whether I have 2 or 4 cores allocated.
I've also found it's pushing power consumption at the wall up from about 75w normal background load to about 130w (or 113w with 2 cores allocated) and can hear the CPU fan speed increase corresponding to the load. It's not just a reporting issue. When I was running it bare metal on my N100 box was 15w at idle at 15-16w at full throughput.
I disabled all the offloads with ethtool in the parent interfaces and the bridges in Proxmox but it didn't make any difference.
My NAS is a VM running Debian using the same VirtIO LAN bridge and I can push 2.3gbps/280MB/s to/from it without any unusual CPU load (just a bit of CPU for Samba in the VM) so this seems to be something specific to FreeBSD.
Top on the host:

OPNsense load in the GUI. 113% would correspond to all 4 of the allocated CPU cores at max load as seen above.

CPU within OPNsense itself is negligibe.

Any assistance would be greatly appreciated.


