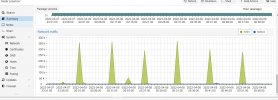
I am running latest version of Proxmox7.1
and everytime I look at netin in the below screenshot I see spikes right around 7 to 10 mins.
Just wondering if this is this normal ?
is seems to be the same when looking at my VM's under this node.
how can I find out what is creating the spikes every 7-10 mins.

PS I have edited the IP address below. this is not my IP address for security but resembles the setup.
/etc/network/interfaces
Proxmox VE
Thank you in advance for your help
- if you need any more info please let me know I can get it for you.
- another question?
could this possibly be from a VM on this node> maybe a running cron job every 10 or so mins?
Does the node shows activity for all of the VM under it in netin graph?
- just want to make sure its not anything with my network configuration or my server host
thanks again for your help in advance
Spiro
and everytime I look at netin in the below screenshot I see spikes right around 7 to 10 mins.
Just wondering if this is this normal ?
is seems to be the same when looking at my VM's under this node.
how can I find out what is creating the spikes every 7-10 mins.

PS I have edited the IP address below. this is not my IP address for security but resembles the setup.
/etc/network/interfaces
Code:
root@proxmox:~# cat /etc/network/interfaces
auto lo
iface lo inet loopback

iface eno1 inet manual

auto vmbr0
iface vmbr0 inet static
        address 23.10.13.15/24
        gateway 23.10.13.1
        bridge_ports eno1
        bridge_stp off
        bridge_fd 0

iface enp2s0f0 inet manual

iface enp2s0f1 inet manual

iface eno2 inet manual
root@proxmox:~#
Proxmox VE
Code:
proxmox-ve: 7.1-1 (running kernel: 5.13.19-6-pve)
pve-manager: 7.1-12 (running version: 7.1-12/b3c09de3)
pve-kernel-helper: 7.1-14
pve-kernel-5.13: 7.1-9
pve-kernel-5.4: 6.4-11
pve-kernel-5.13.19-6-pve: 5.13.19-15
pve-kernel-5.13.19-5-pve: 5.13.19-13
pve-kernel-5.13.19-2-pve: 5.13.19-4
pve-kernel-5.4.157-1-pve: 5.4.157-1
pve-kernel-5.4.73-1-pve: 5.4.73-1
ceph-fuse: 16.2.7
corosync: 3.1.5-pve2
criu: 3.15-1+pve-1
glusterfs-client: 9.2-1
ifupdown: 0.8.36+pve1
ksm-control-daemon: 1.4-1
libjs-extjs: 7.0.0-1
libknet1: 1.22-pve2
libproxmox-acme-perl: 1.4.1
libproxmox-backup-qemu0: 1.2.0-1
libpve-access-control: 7.1-7
libpve-apiclient-perl: 3.2-1
libpve-common-perl: 7.1-5
libpve-guest-common-perl: 4.1-1
libpve-http-server-perl: 4.1-1
libpve-storage-perl: 7.1-1
libqb0: 1.0.5-1
libspice-server1: 0.14.3-2.1
lvm2: 2.03.11-2.1
lxc-pve: 4.0.11-1
lxcfs: 4.0.11-pve1
novnc-pve: 1.3.0-2
proxmox-backup-client: 2.1.5-1
proxmox-backup-file-restore: 2.1.5-1
proxmox-mini-journalreader: 1.3-1
proxmox-widget-toolkit: 3.4-7
pve-cluster: 7.1-3
pve-container: 4.1-4
pve-docs: 7.1-2
pve-edk2-firmware: 3.20210831-2
pve-firewall: 4.2-5
pve-firmware: 3.3-6
pve-ha-manager: 3.3-3
pve-i18n: 2.6-2
pve-qemu-kvm: 6.1.1-2
pve-xtermjs: 4.16.0-1
qemu-server: 7.1-4
smartmontools: 7.2-pve2
spiceterm: 3.2-2
swtpm: 0.7.1~bpo11+1
vncterm: 1.7-1
zfsutils-linux: 2.1.4-pve1
Thank you in advance for your help
- if you need any more info please let me know I can get it for you.
- another question?
could this possibly be from a VM on this node> maybe a running cron job every 10 or so mins?
Does the node shows activity for all of the VM under it in netin graph?
- just want to make sure its not anything with my network configuration or my server host
thanks again for your help in advance
Spiro
Last edited:

