Memory usage increase every day on Linux 6.8.4-3-pve

lukas_dre

New Member
Jun 15, 2024
6
0
1
Hi,
every day after a backup of VMs usage of RAM on some nodes in my cluster increases (from 5GB to 9 GB per day). It happenes until node crashes.

It started to happen after upgrade to Proxmox VE 8.2.2 and kernel 6.8.4-3-pve. As storage we use CEPH. First of all, I thought it was caused by Ceph, but I have some nodes without Ceph with the same issue.

This is the output of free -h on node without Ceph:
Code:
               total        used        free      shared  buff/cache   available
Mem:           251Gi       146Gi        58Gi        94Mi       977Mi       105Gi
Swap:          3.7Gi       3.7Gi       6.2Mi

Memory usage graph in UI says that 192 GB is used. Today I migrated all VMs from node and it is still using 52 GBs of RAM:
Snímek obrazovky z 2024-07-25 11-52-21.png

Output from free -h:
Code:
               total        used        free      shared  buff/cache   available
Mem:           251Gi       3.8Gi       198Gi        70Mi       654Mi       247Gi
Swap:          3.7Gi       202Mi       3.5Gi

Here is graph of memory usage for last month:
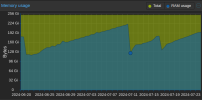
Snímek obrazovky z 2024-07-25 12-13-37.png

Biggest dropdown is caused by reboot to make kernel upgrade to the latest from 6.8.4-3-pve to 6.8.8-2-pve. The issue still persists.

On Kernel 6.5.13-5-pve there wasn't any issue with RAM usage. Today I tried to downgrade kernel on one node, so I will post an update if it helped.
 
You need to find out what takes up all the memory. Showing just a graph will not yield any answers.

A first step would be to create a cronjob to save the ouput of ps and compare it from day to day.
 
You need to find out what takes up all the memory. Showing just a graph will not yield any answers.

A first step would be to create a cronjob to save the ouput of ps and compare it from day to day.
I will try it and make an update, for now I made on another node a list of all running processes and made sum of RAM usage. The result is 127.77 GiB, but UI shows that there is used 517.06 GiB of 755.36 GiB. free -h shows this:
Code:
               total        used        free      shared  buff/cache   available
Mem:           755Gi       127Gi       222Gi        52Mi        16Gi       628Gi
Swap:          3.7Gi       3.7Gi       412Ki
 
I'm seeing the same issue. 3-node pve 8.2.4 cluster running latest kernel (6.8.8-3-pve) with Ceph 17.2.7 (SSD osds) and glusterFS (SATA drives in RAIDZ) shared storage on Dell r730xd servers. Only running one Windows VM with HA and 3 Ubuntu Linux containers for NAT/DHCP server. RAM usage for the Windows VM is only a little over 2gb out of 16gb allocated to it, and only about 38mb out of 512mb for each the containers, however, after only a little over 2.5 days, the RAM used in each host is already around 256gb out of 756gb total (263gb for the one where the Windows VM is active). There's really not a lot of activity on these servers, other than a weeknights backup job of the Windows VM. Happy to provide any logs or info required to track this down. Cluster is kept up-to-date via non-subscription repos.
 
Last edited:
Code:
               total        used        free      shared  buff/cache   available
Mem:           755Gi       127Gi       222Gi        52Mi        16Gi       628Gi
Swap:          3.7Gi       3.7Gi       412Ki
Why is the swap used up? That is not good and could indicate the problem. Misconfigured LX(C) container may be the culprit.

You have still 222 GiB free, which is also not good. A good server has no free memory, yet everything cached.
 
Why is the swap used up? That is not good and could indicate the problem. Misconfigured LX(C) container may be the culprit.

You have still 222 GiB free, which is also not good. A good server has no free memory, yet everything cached.
I don't know why the swap is used up. How can I check?
On this node, I don't have any containers. There are 13 VMs (12 Windows and 1 Linux) with allocated 116 GB RAM in total.
 
I found a new kernel was released over the weekend and I have updated the nodes in my cluster. Initially, now after rebooting from the update, the nodes are running with about 1.16% of CPU or 8.8-9gb of RAM in use. We'll see how it goes over the next few days and I will check to see if and how much the RAM usage creeps up.
 
This morning, RAM usage is on my cluster nodes is up to between 12.33-13% (93-94gb of 756gb used). Nothing else has changed, so still seems to be increasing daily. Will continue to observe and report.
 
Last edited:
RAM usage is now up to 23-24% (175-176gb) on each node after a little over 2 days of uptime, which is an increase of >10% in a day. No change in usage and no running VMs or containers on 2 of the nodes, but still it increased.
 
Hi,
It started to happen after upgrade to Proxmox VE 8.2.2 and kernel 6.8.4-3-pve. As storage we use CEPH. First of all, I thought it was caused by Ceph, but I have some nodes without Ceph with the same issue.
what are you using on the other nodes? Is there similar kinds of workload (e.g. many VMs or mainly containers) between Ceph and non-Ceph nodes?

RAM usage is now up to 23-24% (175-176gb) on each node after a little over 2 days of uptime, which is an increase of >10% in a day. No change in usage and no running VMs or containers on 2 of the nodes, but still it increased.
Is there some other kind of workload running on those nodes or are they basically idling?

@lukas_dre @AppState95 Can you identify user-space processes that are using the memory (e.g. check with top and press Shift+M to order processes by memory usage)? Otherwise this might be a leak in the kernel. Please share the output of
Code:
cat /proc/cmdline
lscpu
pveversion -v
 
This morning all three nodes are using close to 34% of available RAM (~256 out of 756gb).

Code:
root@phantom-pve1:~# cat /proc/cmdline
BOOT_IMAGE=/boot/vmlinuz-6.8.8-4-pve root=/dev/mapper/pve-root ro quiet


root@phantom-pve1:~# lscpu
Architecture:             x86_64
  CPU op-mode(s):         32-bit, 64-bit
  Address sizes:          46 bits physical, 48 bits virtual
  Byte Order:             Little Endian
CPU(s):                   48
  On-line CPU(s) list:    0-47
Vendor ID:                GenuineIntel
  BIOS Vendor ID:         Intel
  Model name:             Intel(R) Xeon(R) CPU E5-2690 v3 @ 2.60GHz
    BIOS Model name:      Intel(R) Xeon(R) CPU E5-2690 v3 @ 2.60GHz  CPU @ 2.6GHz
    BIOS CPU family:      179
    CPU family:           6
    Model:                63
    Thread(s) per core:   2
    Core(s) per socket:   12
    Socket(s):            2
    Stepping:             2
    CPU(s) scaling MHz:   89%
    CPU max MHz:          3500.0000
    CPU min MHz:          1200.0000
    BogoMIPS:             5199.83
    Flags:                fpu vme de pse tsc msr pae mce cx8 apic sep mtrr pge mca cmov pat pse36 clflush dts acpi
                          mmx fxsr sse sse2 ss ht tm pbe syscall nx pdpe1gb rdtscp lm constant_tsc arch_perfmon peb
                          s bts rep_good nopl xtopology nonstop_tsc cpuid aperfmperf pni pclmulqdq dtes64 monitor d
                          s_cpl vmx smx est tm2 ssse3 sdbg fma cx16 xtpr pdcm pcid dca sse4_1 sse4_2 x2apic movbe p
                          opcnt tsc_deadline_timer aes xsave avx f16c rdrand lahf_lm abm cpuid_fault epb pti ssbd i
                          brs ibpb stibp tpr_shadow flexpriority ept vpid ept_ad fsgsbase tsc_adjust bmi1 avx2 smep
                           bmi2 erms invpcid cqm xsaveopt cqm_llc cqm_occup_llc dtherm ida arat pln pts vnmi md_cle
                          ar flush_l1d
Virtualization features: 
  Virtualization:         VT-x
Caches (sum of all):     
  L1d:                    768 KiB (24 instances)
  L1i:                    768 KiB (24 instances)
  L2:                     6 MiB (24 instances)
  L3:                     60 MiB (2 instances)
NUMA:                    
  NUMA node(s):           2
  NUMA node0 CPU(s):      0,2,4,6,8,10,12,14,16,18,20,22,24,26,28,30,32,34,36,38,40,42,44,46
  NUMA node1 CPU(s):      1,3,5,7,9,11,13,15,17,19,21,23,25,27,29,31,33,35,37,39,41,43,45,47
Vulnerabilities:         
  Gather data sampling:   Not affected
  Itlb multihit:          KVM: Mitigation: Split huge pages
  L1tf:                   Mitigation; PTE Inversion; VMX conditional cache flushes, SMT vulnerable
  Mds:                    Mitigation; Clear CPU buffers; SMT vulnerable
  Meltdown:               Mitigation; PTI
  Mmio stale data:        Mitigation; Clear CPU buffers; SMT vulnerable
  Reg file data sampling: Not affected
  Retbleed:               Not affected
  Spec rstack overflow:   Not affected
  Spec store bypass:      Mitigation; Speculative Store Bypass disabled via prctl
  Spectre v1:             Mitigation; usercopy/swapgs barriers and __user pointer sanitization
  Spectre v2:             Mitigation; Retpolines; IBPB conditional; IBRS_FW; STIBP conditional; RSB filling; PBRSB-
                          eIBRS Not affected; BHI Not affected
  Srbds:                  Not affected
  Tsx async abort:        Not affected


root@phantom-pve1:~# pveversion -v
proxmox-ve: 8.2.0 (running kernel: 6.8.8-4-pve)
pve-manager: 8.2.4 (running version: 8.2.4/faa83925c9641325)
proxmox-kernel-helper: 8.1.0
pve-kernel-5.15: 7.4-12
proxmox-kernel-6.8: 6.8.8-4
proxmox-kernel-6.8.8-4-pve-signed: 6.8.8-4
proxmox-kernel-6.8.8-3-pve-signed: 6.8.8-3
proxmox-kernel-6.8.8-2-pve-signed: 6.8.8-2
proxmox-kernel-6.8.8-1-pve-signed: 6.8.8-1
proxmox-kernel-6.8.4-3-pve-signed: 6.8.4-3
proxmox-kernel-6.8.4-2-pve-signed: 6.8.4-2
proxmox-kernel-6.5.13-6-pve-signed: 6.5.13-6
proxmox-kernel-6.5: 6.5.13-6
proxmox-kernel-6.5.13-5-pve-signed: 6.5.13-5
pve-kernel-5.15.149-1-pve: 5.15.149-1
pve-kernel-5.15.143-1-pve: 5.15.143-1
pve-kernel-5.15.131-2-pve: 5.15.131-3
pve-kernel-5.15.102-1-pve: 5.15.102-1
ceph: 17.2.7-pve3
ceph-fuse: 17.2.7-pve3
corosync: 3.1.7-pve3
criu: 3.17.1-2
glusterfs-client: 10.3-5
ifupdown2: 3.2.0-1+pmx9
ksm-control-daemon: 1.5-1
libjs-extjs: 7.0.0-4
libknet1: 1.28-pve1
libproxmox-acme-perl: 1.5.1
libproxmox-backup-qemu0: 1.4.1
libproxmox-rs-perl: 0.3.3
libpve-access-control: 8.1.4
libpve-apiclient-perl: 3.3.2
libpve-cluster-api-perl: 8.0.7
libpve-cluster-perl: 8.0.7
libpve-common-perl: 8.2.1
libpve-guest-common-perl: 5.1.3
libpve-http-server-perl: 5.1.0
libpve-network-perl: 0.9.8
libpve-rs-perl: 0.8.9
libpve-storage-perl: 8.2.3
libspice-server1: 0.15.1-1
lvm2: 2.03.16-2
lxc-pve: 6.0.0-1
lxcfs: 6.0.0-pve2
novnc-pve: 1.4.0-3
openvswitch-switch: 3.1.0-2+deb12u1
proxmox-backup-client: 3.2.7-1
proxmox-backup-file-restore: 3.2.7-1
proxmox-firewall: 0.4.2
proxmox-kernel-helper: 8.1.0
proxmox-mail-forward: 0.2.3
proxmox-mini-journalreader: 1.4.0
proxmox-widget-toolkit: 4.2.3
pve-cluster: 8.0.7
pve-container: 5.1.12
pve-docs: 8.2.2
pve-edk2-firmware: 4.2023.08-4
pve-esxi-import-tools: 0.7.1
pve-firewall: 5.0.7
pve-firmware: 3.13-1
pve-ha-manager: 4.0.5
pve-i18n: 3.2.2
pve-qemu-kvm: 9.0.0-6
pve-xtermjs: 5.3.0-3
qemu-server: 8.2.2
smartmontools: 7.3-pve1
spiceterm: 3.3.0
swtpm: 0.8.0+pve1
vncterm: 1.8.0
zfsutils-linux: 2.2.4-pve1

Here is the output of the TOP shift+M cmd:

Code:
top - 09:50:51 up 3 days, 5 min,  2 users,  load average: 0.00, 0.05, 0.07
Tasks: 824 total,   1 running, 823 sleeping,   0 stopped,   0 zombie
%Cpu(s):  0.1 us,  0.1 sy,  0.0 ni, 99.8 id,  0.0 wa,  0.0 hi,  0.0 si,  0.0 st
MiB Mem : 773922.9 total, 495686.3 free, 275343.5 used,   7150.4 buff/cache   
MiB Swap:  32768.0 total,  32766.5 free,      1.5 used. 498579.4 avail Mem

    PID USER      PR  NI    VIRT    RES    SHR S  %CPU  %MEM     TIME+ COMMAND                                               
  12936 root      20   0   19.0g   8.0g  28884 S   3.0   1.1 192:42.46 kvm                                                   
   4974 ceph      20   0 3155836   2.3g  33540 S   0.3   0.3  16:58.83 ceph-osd                                               
   4943 ceph      20   0 2191908   1.4g  33560 S   0.3   0.2  12:59.71 ceph-osd                                               
   4963 ceph      20   0 2111112   1.3g  34340 S   0.0   0.2  13:06.80 ceph-osd                                               
   4959 ceph      20   0 2007196   1.2g  33620 S   0.3   0.2  15:01.56 ceph-osd                                               
   4975 ceph      20   0 1764408   1.0g  33684 S   0.3   0.1  12:03.43 ceph-osd                                               
   4954 ceph      20   0 1660380 940876  34324 S   0.0   0.1  11:49.58 ceph-osd                                               
   4976 ceph      20   0 1696336 914652  35120 S   0.3   0.1  12:03.82 ceph-osd                                               
   4965 ceph      20   0 1373720 659152  32788 S   0.3   0.1   9:21.88 ceph-osd                                               
   4950 ceph      20   0 1328948 597532  33904 S   0.0   0.1  11:07.40 ceph-osd                                               
   2959 root      10 -10 4587804 529580  13584 S   1.0   0.1  35:53.21 ovs-vswitchd                                           
   3526 ceph      20   0  664788 431680  28344 S   1.0   0.1  30:24.11 ceph-mon                                               
   3525 ceph      20   0  535312 336544  37024 S   0.0   0.0   2:15.89 ceph-mgr                                               
   3593 root      rt   0  559416 166524  52880 S   0.7   0.0  68:57.51 corosync                                               
   6566 www-data  20   0  236372 165536  28736 S   0.0   0.0   0:07.11 pveproxy                                               
1326473 www-data  20   0  256008 160220  12096 S   0.3   0.0   0:03.30 pveproxy worker                                       
1335646 www-data  20   0  251116 156624  12436 S   0.0   0.0   0:00.87 pveproxy worker                                       
1337926 www-data  20   0  245448 147760   8948 S   0.0   0.0   0:00.21 pveproxy worker                                       
1332395 root      20   0  244024 145196   8132 S   0.0   0.0   0:00.49 pvedaemon worke                                       
1326770 root      20   0  243848 144812   7748 S   0.0   0.0   0:03.20 pvedaemon worke                                       
1323141 root      20   0  243876 144416   7736 S   0.0   0.0   0:01.19 pvedaemon worke                                       
1337923 root      20   0  243848 141136   3500 S   0.0   0.0   0:00.01 task UPIDhant                                       
1339653 root      20   0  243848 141136   3500 S   0.0   0.0   0:00.00 task UPIDhant                                       
   4267 root      20   0  234928 139024   3116 S   0.0   0.0   0:03.87 pvedaemon                                             
  12023 root      20   0  216536 115940   3108 S   0.0   0.0   0:20.35 pvescheduler                                           
   5540 root      20   0  220844 113340   3504 S   0.0   0.0   0:51.28 pve-ha-crm                                             
   8835 root      20   0  220388 113136   3852 S   0.0   0.0   1:49.47 pve-ha-lrm                                             
   3914 root      20   0  161016 103996   6584 S   0.0   0.0  27:28.51 pvestatd                                               
   3903 root      20   0  159068 100012   3852 S   0.0   0.0   8:35.36 pve-firewall                                           
   4971 ceph      20   0 1052228  92268  33180 S   0.3   0.0   8:50.53 ceph-osd                                               
   3424 root      20   0 1518128  76684  56336 S   0.0   0.0   9:07.81 pmxcfs                                                 
   6917 www-data  20   0   80772  63092  12788 S   0.0   0.0   0:04.53 spiceproxy

Happy to provide anything else you need. Thanks!
 
Last edited:
Hi,
I have on all nodes many VMs, but only a few containers. I have 2 containers on 2 Ceph nodes (2 containers on each node) and on one non-Ceph node I have only one container. Overall 2 Ceph nodes and one non-Ceph node are running VMs only.

Code:
root@stim-px1:~# cat /proc/cmdline
BOOT_IMAGE=/boot/vmlinuz-6.8.4-3-pve root=UUID=515494b9-db03-45dc-9345-8da47f7605ae ro quiet
root@stim-px1:~# lscpu
Architecture:             x86_64
  CPU op-mode(s):         32-bit, 64-bit
  Address sizes:          48 bits physical, 48 bits virtual
  Byte Order:             Little Endian
CPU(s):                   48
  On-line CPU(s) list:    0-47
Vendor ID:                AuthenticAMD
  BIOS Vendor ID:         Advanced Micro Devices, Inc.
  Model name:             AMD EPYC 7443 24-Core Processor
    BIOS Model name:      AMD EPYC 7443 24-Core Processor                 Unknown CPU @ 2.8GHz
    BIOS CPU family:      107
    CPU family:           25
    Model:                1
    Thread(s) per core:   2
    Core(s) per socket:   24
    Socket(s):            1
    Stepping:             1
    Frequency boost:      enabled
    CPU(s) scaling MHz:   88%
    CPU max MHz:          4035.6440
    CPU min MHz:          1500.0000
    BogoMIPS:             5689.54
    Flags:                fpu vme de pse tsc msr pae mce cx8 apic sep mtrr pge mca cmov pat pse36 clflush mmx fxsr sse sse2 ht syscall nx mmxext fxsr_opt pdpe1gb rdtscp lm constant_tsc rep_g
                          ood nopl nonstop_tsc cpuid extd_apicid aperfmperf rapl pni pclmulqdq monitor ssse3 fma cx16 pcid sse4_1 sse4_2 movbe popcnt aes xsave avx f16c rdrand lahf_lm cmp_le
                          gacy svm extapic cr8_legacy abm sse4a misalignsse 3dnowprefetch osvw ibs skinit wdt tce topoext perfctr_core perfctr_nb bpext perfctr_llc mwaitx cpb cat_l3 cdp_l3 h
                          w_pstate ssbd mba ibrs ibpb stibp vmmcall fsgsbase bmi1 avx2 smep bmi2 erms invpcid cqm rdt_a rdseed adx smap clflushopt clwb sha_ni xsaveopt xsavec xgetbv1 xsaves
                          cqm_llc cqm_occup_llc cqm_mbm_total cqm_mbm_local user_shstk clzero irperf xsaveerptr rdpru wbnoinvd amd_ppin brs arat npt lbrv svm_lock nrip_save tsc_scale vmcb_cl
                          ean flushbyasid decodeassists pausefilter pfthreshold v_vmsave_vmload vgif v_spec_ctrl umip pku ospke vaes vpclmulqdq rdpid overflow_recov succor smca fsrm debug_sw
                          ap
Virtualization features: 
  Virtualization:         AMD-V
Caches (sum of all):     
  L1d:                    768 KiB (24 instances)
  L1i:                    768 KiB (24 instances)
  L2:                     12 MiB (24 instances)
  L3:                     128 MiB (4 instances)
NUMA:                     
  NUMA node(s):           1
  NUMA node0 CPU(s):      0-47
Vulnerabilities:         
  Gather data sampling:   Not affected
  Itlb multihit:          Not affected
  L1tf:                   Not affected
  Mds:                    Not affected
  Meltdown:               Not affected
  Mmio stale data:        Not affected
  Reg file data sampling: Not affected
  Retbleed:               Not affected
  Spec rstack overflow:   Mitigation; Safe RET
  Spec store bypass:      Mitigation; Speculative Store Bypass disabled via prctl
  Spectre v1:             Mitigation; usercopy/swapgs barriers and __user pointer sanitization
  Spectre v2:             Mitigation; Retpolines; IBPB conditional; IBRS_FW; STIBP always-on; RSB filling; PBRSB-eIBRS Not affected; BHI Not affected
  Srbds:                  Not affected
  Tsx async abort:        Not affected

root@stim-px1:~# pveversion -v
proxmox-ve: 8.2.0 (running kernel: 6.8.4-3-pve)
pve-manager: 8.2.2 (running version: 8.2.2/9355359cd7afbae4)
proxmox-kernel-helper: 8.1.0
pve-kernel-6.2: 8.0.5
proxmox-kernel-6.8: 6.8.4-3
proxmox-kernel-6.8.4-3-pve-signed: 6.8.4-3
proxmox-kernel-6.5.13-5-pve-signed: 6.5.13-5
proxmox-kernel-6.5: 6.5.13-5
proxmox-kernel-6.5.11-7-pve-signed: 6.5.11-7
proxmox-kernel-6.2.16-20-pve: 6.2.16-20
proxmox-kernel-6.2: 6.2.16-20
amd64-microcode: 3.20230808.1.1~deb12u1
ceph: 18.2.2-pve1
ceph-fuse: 18.2.2-pve1
corosync: 3.1.7-pve3
criu: 3.17.1-2
glusterfs-client: 10.3-5
ifupdown: residual config
ifupdown2: 3.2.0-1+pmx8
libjs-extjs: 7.0.0-4
libknet1: 1.28-pve1
libproxmox-acme-perl: 1.5.1
libproxmox-backup-qemu0: 1.4.1
libproxmox-rs-perl: 0.3.3
libpve-access-control: 8.1.4
libpve-apiclient-perl: 3.3.2
libpve-cluster-api-perl: 8.0.6
libpve-cluster-perl: 8.0.6
libpve-common-perl: 8.2.1
libpve-guest-common-perl: 5.1.1
libpve-http-server-perl: 5.1.0
libpve-network-perl: 0.9.8
libpve-rs-perl: 0.8.8
libpve-storage-perl: 8.2.1
libspice-server1: 0.15.1-1
lvm2: 2.03.16-2
lxc-pve: 6.0.0-1
lxcfs: 6.0.0-pve2
novnc-pve: 1.4.0-3
proxmox-backup-client: 3.2.2-1
proxmox-backup-file-restore: 3.2.2-1
proxmox-kernel-helper: 8.1.0
proxmox-mail-forward: 0.2.3
proxmox-mini-journalreader: 1.4.0
proxmox-offline-mirror-helper: 0.6.6
proxmox-widget-toolkit: 4.2.3
pve-cluster: 8.0.6
pve-container: 5.1.10
pve-docs: 8.2.2
pve-edk2-firmware: 4.2023.08-4
pve-esxi-import-tools: 0.7.0
pve-firewall: 5.0.7
pve-firmware: 3.11-1
pve-ha-manager: 4.0.4
pve-i18n: 3.2.2
pve-qemu-kvm: 8.1.5-6
pve-xtermjs: 5.3.0-3
qemu-server: 8.2.1
smartmontools: 7.3-pve1
spiceterm: 3.3.0
swtpm: 0.8.0+pve1
vncterm: 1.8.0
zfsutils-linux: 2.2.3-pve2

Output from top shift M:
Code:
top - 17:12:32 up 71 days, 19:43,  3 users,  load average: 1.77, 1.95, 2.23
Tasks: 698 total,   1 running, 697 sleeping,   0 stopped,   0 zombie
%Cpu(s):  1.2 us,  0.6 sy,  0.0 ni, 97.4 id,  0.0 wa,  0.0 hi,  0.1 si,  0.0 st
MiB Mem : 773486.8 total, 161950.0 free, 147768.3 used,  28402.4 buff/cache     
MiB Swap:   3812.0 total,      0.1 free,   3811.9 used. 625718.5 avail Mem

    PID USER      PR  NI    VIRT    RES    SHR S  %CPU  %MEM     TIME+ COMMAND                                                                                                               
  46135 root      20   0   37.2g  32.4g  23808 S   4.0   4.3     6d+1h kvm                                                                                                                   
  44437 root      20   0   12.1g  10.2g  22656 S   9.3   1.4   10d+12h kvm                                                                                                                   
 357091 root      20   0   10.8g   8.4g  23808 S   3.3   1.1    5d+17h kvm                                                                                                                   
1981332 root      20   0   11.3g   8.3g  25344 S   3.6   1.1     32,00 kvm                                                                                                                   
  44435 root      20   0   13.0g   8.2g  21888 S   2.3   1.1     47,46 kvm                                                                                                                   
2078416 root      20   0   10.6g   8.2g  30720 S   2.6   1.1  52:58.96 kvm                                                                                                                   
2122311 root      20   0   10.5g   8.1g  30720 S   1.3   1.1  11:48.79 kvm                                                                                                                   
3571719 root      20   0   17.9g   8.1g  21120 S   8.3   1.1    4d+17h kvm                                                                                                                   
3571016 root      20   0    9.8g   8.0g  20736 S   2.0   1.1     72,09 kvm                                                                                                                   
3571336 root      20   0 9949052   5.4g  21504 S   0.3   0.7      8,05 kvm                                                                                                                   
  44234 root      20   0 8108660   4.3g  23424 S   3.0   0.6     4d+1h kvm                                                                                                                   
  46374 root      20   0 7830516   4.3g  22656 S   7.9   0.6    5d+22h kvm                                                                                                                   
 356680 root      20   0 6082716   4.2g  22656 S   7.0   0.6    5d+11h kvm                                                                                                                   
 356576 root      20   0 5930440   4.2g  22656 S   3.6   0.6     61,25 kvm                                                                                                                   
   4996 ceph      20   0 4500840   2.4g  21120 S   3.3   0.3    5d+22h ceph-osd                                                                                                               
   4998 ceph      20   0 4202704   2.4g  20736 S   2.6   0.3    4d+13h ceph-osd                                                                                                               
   4994 ceph      20   0 4576044   2.4g  21120 S   9.6   0.3     5d+1h ceph-osd                                                                                                               
   4997 ceph      20   0 4297744   2.4g  21120 S   5.0   0.3     7d+4h ceph-osd                                                                                                               
2685066 root      20   0 5183976   2.2g  24192 S   3.3   0.3     16,14 kvm                                                                                                                   
   4476 ceph      20   0  851084 501960  25728 S   0.7   0.1     12,58 ceph-mon                                                                                                               
   4475 ceph      20   0 1575280 335616  28416 S   0.3   0.0 251:59.99 ceph-mgr                                                                                                               
   4490 root      rt   0  570640 177320  52524 S   2.0   0.0     26,13 corosync                                                                                                               
   5454 www-data  20   0  248048 169344  31872 S   0.0   0.0   3:49.38 pveproxy                                                                                                               
2203044 www-data  20   0  260712 154044  12672 S   0.7   0.0   0:01.63 pveproxy worker                                                                                                       
2207227 www-data  20   0  260024 154044  12288 S   0.0   0.0   0:00.60 pveproxy worker                                                                                                       
2209615 www-data  20   0  257724 150972  11520 S   0.0   0.0   0:00.07 pveproxy worker                                                                                                       
    900 root      20   0  139844  74604  74220 S   0.0   0.0   3:10.27 systemd-journal                                                                                                       
   6192 www-data  20   0   80896  62976  13056 S   0.0   0.0   1:09.69 spiceproxy                                                                                                             
1146751 www-data  20   0   81324  54504   4224 S   0.0   0.0   0:00.63 spiceproxy work                                                                                                       
   4784 root      20   0  173540  48848   6528 S   0.0   0.0     12,59 pvestatd                                                                                                               
2188121 root      20   0  258892  48160  11904 S   0.0   0.0   0:03.03 pvedaemon worke                                                                                                       
2189037 root      20   0  259028  47008  11520 S   0.3   0.0   0:02.58 pvedaemon worke                                                                                                       
   4210 root      20   0  779608  45864  35672 S   1.3   0.0     10,47 pmxcfs                                                                                                                 
   4779 root      20   0  171824  45084   4608 S   0.0   0.0      9,50 pve-firewall                                                                                                           
2193792 root      20   0  256128  44704  11904 S   0.3   0.0   0:03.28 pvedaemon worke                                                                                                       
   6195 root      20   0  232352  44284   4224 S   1.7   0.0      6,54 pve-ha-lrm                                                                                                             
    914 root      20   0   80580  32256  10368 S   0.0   0.0   2:50.09 dmeventd                                                                                                               
   5128 root      20   0  246668  26344   3456 S   0.0   0.0   1:09.33 pvedaemon

I'm ready to provide anything else you need. Thank you for looking into this!
 
root@stim-px1:~# pveversion -v
proxmox-ve: 8.2.0 (running kernel: 6.8.4-3-pve)
Please upgrade to the latest kernel version and see if the issue persists. Kernel memory leaks for NFS server code and CIFS/SMB client code where fixed since then. Even if you are not using those, there were more stable fixes between 6.8.4 and 6.8.8, so it's worth a try in any case.
 
Hi Fiona,

This morning the RAM usage is up to ~44-45% or ~336-345gb out of 756gb. There were new updates again today, so I installed them, but none appeared to require rebooting, so I have not rebooted the nodes yet.

Here is the output from the
Code:
cat /proc/spl/kstat/zfs/arcstats | grep -e '^size' -e '^c\s' -e '^c_max'
command:

Code:
root@phantom-pve1:~# cat /proc/spl/kstat/zfs/arcstats | grep -e '^size' -e '^c\s' -e '^c_max'
c                               4    343520802944
c_max                           4    405758511104
size                            4    343264990024
root@phantom-pve1:~#

Here is the output from the 'free' command:

Code:
root@phantom-pve2:/# free
               total        used        free      shared  buff/cache   available
Mem:       792497092   357859000   431511568       67392     7472912   434638092
Swap:       33554428         256    33554172
root@phantom-pve2:/#

Looking at my disk setup, I have 2 3.84TB SSDs in a hardware RAID1 for the boot drive, and then the other 10 of my 3.84TB SSDs are ceph OSDs in a ~104TB cluster.

The back 12 disks are 2TB SAS drives and they were configured in a 21TB RAIDZ on each server, and then clustered into one 42TB GlusterFS shared storage for multiple copy redundancy purposes. (Maybe that was unnecessary, as admittedly I wasn't that familiar with RAIDZ when I set this up.) EDIT: I think this is the article with the "dispersed volume" steps that I followed, when setting up the RAIDZ and shared GlusterFS storage.
PVE-Phantom-Storage.PNG

VM and container disks live on the Ceph (SSDs) and backups are stored in the GlusterFS storage.

All 3 server nodes are Dell r730xd and configured identically, hardware-wise.

Thanks for your help and your time in looking into this.
 
Last edited:
If my memory servers me well (I'm more used to the arc_summary command's output), this:

Code:
root@phantom-pve1:~# cat /proc/spl/kstat/zfs/arcstats | grep -e '^size' -e '^c\s' -e '^c_max'
c                               4    343520802944
c_max                           4    405758511104
size                            4    343264990024

means that ZFS arc caché is using around 350GB from the ~400GB max that ir can use. That roughly matches the amounts you mention in your posts. You can limit how much memory ARC uses [1].

[1] https://pve.proxmox.com/wiki/ZFS_on_Linux#sysadmin_zfs_limit_memory_usage
 
  • Like
Reactions: fiona
Please upgrade to the latest kernel version and see if the issue persists. Kernel memory leaks for NFS server code and CIFS/SMB client code where fixed since then. Even if you are not using those, there were more stable fixes between 6.8.4 and 6.8.8, so it's worth a try in any case.
I upgraded one node yesterday evening. I will post an update if the problem persists.
 
Thanks, VictorSTS and Fiona.

I set the minimum and maximum arc values for my server nodes as instructed in the article. I now have the minimum set to 24gb (I have roughly 21.8TB ZFS per node, so ~22gb + 2gb=24gb) and max at 128gb (or 1/6th total RAM). That immediately trimmed the RAM usage back to around 148-155gb per host.

I will run with these as temporary settings for a few days and then, if all is well, make them permanent in the /etc/modprobe.d/zfs.conf file. Just FYI, the previous values for zfs_arc_min and zfs_arc_max were both set to 0.
 
After setting the zfs_arc_min and zfs_arc_max as mentioned above, the RAM utilized in my cluster nodes appears to now be stable, hovering around 19-20% or ~150gb out of 756gb. Thanks again for the help. I think for my environment, at least, this issue is resolved.
 
  • Like
Reactions: VictorSTS

About

The Proxmox community has been around for many years and offers help and support for Proxmox VE, Proxmox Backup Server, and Proxmox Mail Gateway.
We think our community is one of the best thanks to people like you!

Get your subscription!

The Proxmox team works very hard to make sure you are running the best software and getting stable updates and security enhancements, as well as quick enterprise support. Tens of thousands of happy customers have a Proxmox subscription. Get yours easily in our online shop.

Buy now!