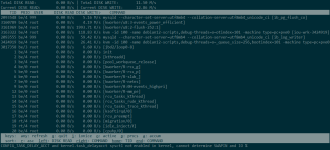
I'm encountering disk space issues with LXC containers in my Proxmox VE environment. I have deployed two systems: an LXC container running Debian and a QEMU virtual machine also running Debian, occupying 6GB and 8GB respectively. Both systems primarily execute lightweight Python scripts handling API requests, with minimal I/O operations. Each also runs a headless Chrome instance for web scraping purposes.
The concerning observation is that the LXC container's raw disk file grows by 1-2GB daily within the Proxmox environment. Without manual intervention, this would expand to 30-40GB within a month. In contrast, the QEMU virtual machine maintains stable storage usage despite running nearly identical workloads.
When examining storage usage within the LXC container via df, it reports approximately 6.X GB consumption. However, when executing du -sh /var/lib/vz/lxcid ,The storage allocation increases progressively each day.
For the LXC container, my current mitigation involves periodically executing fstrim -v / within the system to reclaim space. When examining disk metrics via smartctl on the Proxmox host, I noticed significantly higher write operations compared to reads, as shown below:
SMART/Health Information (NVMe Log 0x02)
Critical Warning: 0x00
Temperature: 35 Celsius
Available Spare: 100%
Available Spare Threshold: 10%
Percentage Used: 1%
Data Units Read: 1,332,881 [682 GB]
Data Units Written: 5,833,975 [2.98 TB]
Host Read Commands: 14,934,034
Host Write Commands: 223,420,452
Controller Busy Time: 4,397
Power Cycles: 98
Power On Hours: 1,603
Unsafe Shutdowns: 18
Media and Data Integrity Errors: 0
Error Information Log Entries: 0
Warning Comp. Temperature Time: 0
Critical Comp. Temperature Time: 0
I would appreciate any insights into this disproportionate storage growth in the LXC environment.


