CPU Temp and HDD S.M.A.R.T. Status - how do I see these?

bearhntr

Member
Sep 9, 2022
181
15
23
Atlanta, GA USA
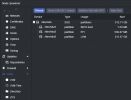
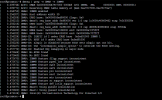
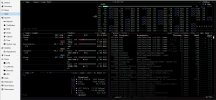
I have just installed Proxmox VE 7.2-3 (and upgraded to 7.2-11) on an HP Z240 Workstation with 512 GB SSD and 64GB RAM. I have installed the lm-sensors under the SHELL, and I am getting CPU temp there (see image) but I do not see these anywhere in the Console. I am moving over from vmWare ESXi - of which I am familiar and can see both of these.
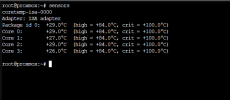
1665751116136.png

This shows that it is there and enabled - but I cannot see it in the Console.
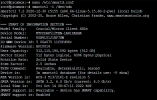
1665751689356.png
 
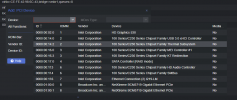
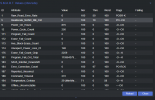
I am also hoping -- as I have enabled IOMMU and can see the INTEL - Thermal Sensors in PCI DEVICES - that I can pass this information into the VMs. Once that I more commonly use (pfSense and HomeAssistant)

1665753691950.png


1665753758402.png
 
To those, who suggest to use telegraf + influxdb + grafana: it works somewhat well if telegraf is running on the host and reports into e.g. an influxdb, that runs in a container of any sorts. However: it doesn't work as well if you do not want to install telegraf on the host. I am also pretty sure you need access to the drives themselves (not just volumes) to monitor them somewhere (e.g. using `smartctl`).

So if I have to install something to read data from the host anyway (host CPU/RAM/disks), why should I have to install telegraf, influxdb or grafana? I personally am using the capabilities of the IPMI, that I have, but I can imagine someone would prefer to monitor the host using the host system. And if I already have a pretty and working web UI like Proxmox, why not open it up for plugins and enhancements (if you do not want to include all those different temperature "pages")?