Hi all!
I have been install proxmox with Ceph hci, this is my hardware
Dell R730+PERC H730mini Controller
Ceph network 40Gbps melanox
7xOSD ssd samsung pm
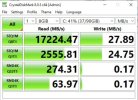
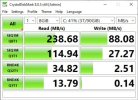
I have 3 server with same hardware above but I was test Iops on VM very poor, is there anyone sugest tunning ? if I run ceph on centos 7 i it is good
this is my test
Pool config:
On vm
I have been install proxmox with Ceph hci, this is my hardware
Dell R730+PERC H730mini Controller
Ceph network 40Gbps melanox
7xOSD ssd samsung pm
I have 3 server with same hardware above but I was test Iops on VM very poor, is there anyone sugest tunning ? if I run ceph on centos 7 i it is good
this is my test
Pool config:
Code:
pool 3 'vmstorage' replicated size 3 min_size 2 crush_rule 0 object_hash rjenkins pg_num 32 pgp_num 32 autoscale_mode on last_change 9674 lfor 0/9674/9672 flags hashpspool,selfmanaged_snaps stripe_width 0 application rbd read_balance_score 2.63
Code:
rados bench 600 write -b 4M -t 16 --no-cleanup -p vmstorage
Total time run:         601.397
Total writes made:      34052
Write size:             4194304
Object size:            4194304
Bandwidth (MB/sec):     226.486
Stddev Bandwidth:       158.62
Max bandwidth (MB/sec): 1056
Min bandwidth (MB/sec): 0
Average IOPS:           56
Stddev IOPS:            39.6706
Max IOPS:               264
Min IOPS:               0
Average Latency(s):     0.282572
Stddev Latency(s):      0.572651
Max latency(s):         5.05261
Min latency(s):         0.016285
Code:
ceph tell osd.0 bench
{
    "bytes_written": 1073741824,
    "blocksize": 4194304,
    "elapsed_sec": 2.4117983039999999,
    "bytes_per_sec": 445203822.48349071,
    "iops": 106.14486276709812
}
Code:
root@ubuntu:~# fio --rw=write --name=test --size=20M --direct=1
test: (g=0): rw=write, bs=(R) 4096B-4096B, (W) 4096B-4096B, (T) 4096B-4096B, ioengine=psync, iodepth=1
fio-3.36
Starting 1 process
Jobs: 1 (f=1): [W(1)][94.3%][w=900KiB/s][w=225 IOPS][eta 00m:02s]
test: (groupid=0, jobs=1): err= 0: pid=1639: Sat Feb 15 13:53:04 2025
  write: IOPS=153, BW=613KiB/s (627kB/s)(20.0MiB/33424msec); 0 zone resets
    clat (usec): min=1002, max=1200.4k, avg=6525.68, stdev=70473.45
     lat (usec): min=1002, max=1200.4k, avg=6526.06, stdev=70473.45
    clat percentiles (usec):
     |  1.00th=[   1020],  5.00th=[   1029], 10.00th=[   1037],
     | 20.00th=[   1045], 30.00th=[   1057], 40.00th=[   1074],
     | 50.00th=[   1074], 60.00th=[   1090], 70.00th=[   1090],
     | 80.00th=[   1106], 90.00th=[   1123], 95.00th=[   1156],
     | 99.00th=[   3949], 99.50th=[ 809501], 99.90th=[ 985662],
     | 99.95th=[1002439], 99.99th=[1199571]
   bw (  KiB/s): min=   32, max= 3672, per=100.00%, avg=1068.67, stdev=1004.26, samples=36
   iops        : min=    8, max=  918, avg=267.17, stdev=251.07, samples=36
  lat (msec)   : 2=98.79%, 4=0.31%, 10=0.29%, 500=0.02%, 1000=0.53%
  lat (msec)   : 2000=0.06%
  cpu          : usr=0.11%, sys=0.40%, ctx=5125, majf=0, minf=14
  IO depths    : 1=100.0%, 2=0.0%, 4=0.0%, 8=0.0%, 16=0.0%, 32=0.0%, >=64=0.0%
     submit    : 0=0.0%, 4=100.0%, 8=0.0%, 16=0.0%, 32=0.0%, 64=0.0%, >=64=0.0%
     complete  : 0=0.0%, 4=100.0%, 8=0.0%, 16=0.0%, 32=0.0%, 64=0.0%, >=64=0.0%
     issued rwts: total=0,5120,0,0 short=0,0,0,0 dropped=0,0,0,0
     latency   : target=0, window=0, percentile=100.00%, depth=1

Run status group 0 (all jobs):
  WRITE: bw=613KiB/s (627kB/s), 613KiB/s-613KiB/s (627kB/s-627kB/s), io=20.0MiB (21.0MB), run=33424-33424msec

Disk stats (read/write):
  vda: ios=0/5101, sectors=0/40864, merge=0/7, ticks=0/33576, in_queue=33590, util=98.20%
Code:
fio --ioengine=psync --filename=/tmp/testdisk --size=9G --time_based --name=fio --group_reporting --runtime=600 --direct=1 --sync=1 --rw=write --bs=4M --numjobs=4 --iodepth=32
fio: (g=0): rw=write, bs=(R) 4096KiB-4096KiB, (W) 4096KiB-4096KiB, (T) 4096KiB-4096KiB, ioengine=psync, iodepth=32
...
fio-3.36
Starting 4 processes
fio: Laying out IO file (1 file / 9216MiB)
note: both iodepth >= 1 and synchronous I/O engine are selected, queue depth will be capped at 1
note: both iodepth >= 1 and synchronous I/O engine are selected, queue depth will be capped at 1
note: both iodepth >= 1 and synchronous I/O engine are selected, queue depth will be capped at 1
note: both iodepth >= 1 and synchronous I/O engine are selected, queue depth will be capped at 1
Jobs: 4 (f=4): [W(4)][100.0%][w=4100KiB/s][w=1 IOPS][eta 00m:00s]
fio: (groupid=0, jobs=4): err= 0: pid=1642: Sat Feb 15 14:04:46 2025
  write: IOPS=3, BW=14.7MiB/s (15.4MB/s)(8804MiB/600532msec); 0 zone resets
    clat (msec): min=34, max=5028, avg=1091.13, stdev=957.23
     lat (msec): min=35, max=5028, avg=1091.37, stdev=957.23
    clat percentiles (msec):
     |  1.00th=[   39],  5.00th=[   41], 10.00th=[   43], 20.00th=[   52],
     | 30.00th=[  253], 40.00th=[  969], 50.00th=[  995], 60.00th=[ 1020],
     | 70.00th=[ 1217], 80.00th=[ 1972], 90.00th=[ 2022], 95.00th=[ 3004],
     | 99.00th=[ 4010], 99.50th=[ 4245], 99.90th=[ 5000], 99.95th=[ 5000],
     | 99.99th=[ 5000]
   bw (  KiB/s): min=32768, max=204800, per=100.00%, avg=44975.73, stdev=6158.56, samples=1601
   iops        : min=    8, max=   50, avg=10.98, stdev= 1.50, samples=1601
  lat (msec)   : 50=17.58%, 100=10.22%, 250=1.64%, 500=2.00%, 750=0.18%
  lat (msec)   : 1000=21.04%, 2000=32.89%, >=2000=14.45%
  cpu          : usr=0.03%, sys=0.02%, ctx=7213, majf=0, minf=44
  IO depths    : 1=100.0%, 2=0.0%, 4=0.0%, 8=0.0%, 16=0.0%, 32=0.0%, >=64=0.0%
     submit    : 0=0.0%, 4=100.0%, 8=0.0%, 16=0.0%, 32=0.0%, 64=0.0%, >=64=0.0%
     complete  : 0=0.0%, 4=100.0%, 8=0.0%, 16=0.0%, 32=0.0%, 64=0.0%, >=64=0.0%
     issued rwts: total=0,2201,0,0 short=0,0,0,0 dropped=0,0,0,0
     latency   : target=0, window=0, percentile=100.00%, depth=32

Run status group 0 (all jobs):
  WRITE: bw=14.7MiB/s (15.4MB/s), 14.7MiB/s-14.7MiB/s (15.4MB/s-15.4MB/s), io=8804MiB (9232MB), run=600532-600532msec

Disk stats (read/write):
  vda: ios=4/11079, sectors=664/18055576, merge=0/1850, ticks=649/6081823, in_queue=6676218, util=99.62%