[SOLVED] 500 Internal Server Error on Raspberry Pi Docker prometheus-pve-exporter

zimbolearner

New Member
Dec 9, 2025
3
2
3
Hi, I’m trying to run prometheus-pve-exporter on a Raspberry Pi to scrape metrics from my Proxmox 9 server. I’ve installed the Docker container, mounted my pve.yml config, and tried to access metrics, but I always get a 500 Internal Server Error.

YAML:
#~/pve-exporter/pve.yml
default:
  user: "prometheus@pve"
  token_name: "prometheus-token"
  token_value: "XXXX-XXX"
  verify_ssl: false

Then I run the docker container with the exporter
Bash:
docker run -d \
  --name pve-exporter \
  -p 9221:9221 \
  -v ~/pve-exporter/pve.yml:/etc/prometheus/pve.yml:ro \
  ghcr.io/prometheus-pve/prometheus-pve-exporter:latest \
  --config.file=/etc/prometheus/pve.yml

The I try a curl : curl "http://localhost:9221/pve?target=192.168.x.x"

my ouput is this
Bash:
<!doctype html>
<html lang=en>
<title>500 Internal Server Error</title>
<h1>Internal Server Error</h1>
<p>The server encountered an internal error and was unable to complete your request. Either the server is overloaded or there is an error in the application.</p>

Please note the token, and user are created and have the PVEAuditor privilege.
 
Hi zimbolearner,
can you Providence the docker logs for that container?

BR, Lucas
docker logs
Bash:
[2025-12-10 07:56:09 +0000] [7] [INFO] Handling signal: term
[2025-12-10 07:56:09 +0000] [8] [INFO] Worker exiting (pid: 8)
[2025-12-10 07:56:09 +0000] [7] [INFO] Shutting down: Master
[2025-12-10 07:56:10 +0000] [7] [INFO] Starting gunicorn 23.0.0
[2025-12-10 07:56:10 +0000] [7] [INFO] Listening at: http://[::]:9221 (7)
[2025-12-10 07:56:10 +0000] [7] [INFO] Using worker: gthread
[2025-12-10 07:56:10 +0000] [8] [INFO] Booting worker with pid: 8
Exception thrown while rendering view
Traceback (most recent call last):
  File "/opt/prometheus-pve-exporter/lib/python3.12/site-packages/pve_exporter/http.py", line 101, in view
    return view_registry[endpoint](**params)
           ^^^^^^^^^^^^^^^^^^^^^^^^^^^^^^^^^
  File "/opt/prometheus-pve-exporter/lib/python3.12/site-packages/pve_exporter/http.py", line 37, in on_pve
    output = collect_pve(
             ^^^^^^^^^^^^
  File "/opt/prometheus-pve-exporter/lib/python3.12/site-packages/pve_exporter/collector/__init__.py", line 58, in collect_pve
    return generate_latest(registry)
           ^^^^^^^^^^^^^^^^^^^^^^^^^
  File "/opt/prometheus-pve-exporter/lib/python3.12/site-packages/prometheus_client/exposition.py", line 289, in generate_latest
    for metric in registry.collect():
                  ^^^^^^^^^^^^^^^^^^
  File "/opt/prometheus-pve-exporter/lib/python3.12/site-packages/prometheus_client/registry.py", line 97, in collect
    yield from collector.collect()
  File "/opt/prometheus-pve-exporter/lib/python3.12/site-packages/pve_exporter/collector/cluster.py", line 33, in collect
    for entry in self._pve.cluster.status.get():
                 ^^^^^^^^^^^^^^^^^^^^^^^^^^^^^^
  File "/opt/prometheus-pve-exporter/lib/python3.12/site-packages/proxmoxer/core.py", line 167, in get
    return self(args)._request("GET", params=params)
           ^^^^^^^^^^^^^^^^^^^^^^^^^^^^^^^^^^^^^^^^^
  File "/opt/prometheus-pve-exporter/lib/python3.12/site-packages/proxmoxer/core.py", line 147, in _request
    raise ResourceException(
proxmoxer.core.ResourceException: 403 Forbidden: Permission check failed (/, Sys.Audit)

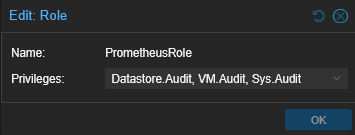
Ended up creating a custom role instead of using PVEAuditor
1765353563362.png
 
Last edited: